Structure of the insurance industry in Kenya - 2018
Structure of insurance industry in Kenya: evolution of premiums per class of business (2017-2018)
in thousands USD| 2014 | 2015 | 2016 | 2017 | 2018 | 2018 shares | |
|---|---|---|---|---|---|---|
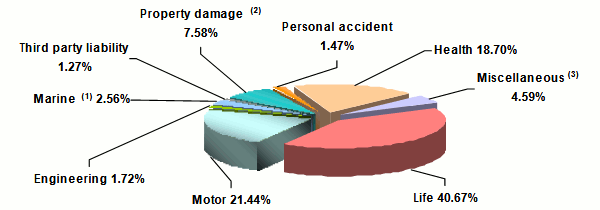
Motor | 437 251 | 428 132 | 442 191 | 437 276 | 454 895 | 21.44% |
Engineering | 39 844 | 37 932 | 34 523 | 40 982 | 36 435 | 1.72% |
Marine (1) | 44 101 | 43 154 | 40 503 | 51 659 | 54 333 | 2.56% |
Third party liability | 21 240 | 21 850 | 25 050 | 27 556 | 26 934 | 1.27% |
Property damage (2) | 153 397 | 146 763 | 152 350 | 161 231 | 160 722 | 7.58% |
Personal accident | 40 479 | 38 768 | 39 783 | 34 388 | 31 162 | 1.47% |
Health | 284 288 | 293 689 | 382 844 | 374 939 | 396 734 | 18.70% |
Miscellaneous (3) | 93 150 | 88 941 | 92 559 | 92 313 | 97 326 | 4.59% |
Total non life | 1 113 750 | 1 099 229 | 1 209 803 | 1 220 344 | 1 258 541 | 59.33% |
Life (4) | 635 409 | 617 545 | 730 779 | 809 861 | 862 720 | 40.67% |
| Grand total | 1 749 159 | 1 716 774 | 1 940 582 | 2 030 205 | 2 121 261 | 100% |
Turnover 2018 per class of business
(1) Including aviation and maritime transport
(2) Inclding theft and fire
(3) Including workmen’s compensation
(4) Including group health, pension and sinking fund insurance
Read also | Ranking of insurance companies in kenya - 2018
Structure of insurance industry in Kenya: Net loss ratio per class of business in 2018
Figures in thousands| Net incurred losses | Net earned premiums | Net loss ratio | |||
|---|---|---|---|---|---|
| in KES | in USD | in KES | in USD | ||
Motor | 27 919 745 | 275 568 | 43 414 086 | 428 497 | 64.31% |
Engineering | 411 244 | 4 059 | 932 975 | 9 208 | 44.08% |
Marine (1) | 697 734 | 6 887 | 2 038 541 | 20 120 | 34.23% |
Third party liability | 597 548 | 5 898 | 1 289 380 | 12 726 | 46.34% |
Property damage (2) | 2 923 503 | 28 855 | 6 580 065 | 64 945 | 44.43% |
Personal accident | 747 352 | 7 376 | 2 294 610 | 22 648 | 32.57% |
Health | 20 515 402 | 202 487 | 27 133 652 | 267 809 | 75.61% |
Miscellaneous (3) | 3 115 468 | 30 750 | 7 400 368 | 73 042 | 42.10% |
| Total non-life | 56 927 996 | 561 879 | 91 083 677 | 898 996 | 62.50% |
Structure of insurance industry in Kenya: Net management expenses ratio per class of business in 2018
Figures in thousands| Management expenses | Net written premiums | Net management expenses ratio | |||
|---|---|---|---|---|---|
| in KES | in USD | in KES | in USD | ||
Motor | 18 946 062 | 186 998 | 43 701 343 | 431 332 | 43.35% |
Engineering | 496 102 | 4 897 | 886 630 | 8 751 | 55.95% |
Marine (1) | 1 050 024 | 10 364 | 1 963 742 | 19 382 | 53.47% |
Third party liability | 560 038 | 5 528 | 1 254 715 | 12 384 | 44.63% |
Property damage (2) | 3 347 850 | 33 043 | 6 607 013 | 65 211 | 50.67% |
Personal accident | 1 311 475 | 12 944 | 2 178 516 | 21 502 | 60.20% |
Health | 7 626 480 | 75 273 | 27 878 786 | 275 164 | 27.36% |
Miscellaneous (3) | 3 406 440 | 33 622 | 7 489 705 | 73 923 | 45.48% |
| Total non life | 36 744 471 | 362 668 | 91 960 450 | 907 650 | 39.96% |
(1) including aviation
(2) including theft and fire
(3) including workmen’s compensation
Structure of insurance industry in Kenya: Combined ratio per class of business in 2018
| Net loss ratio | Management expenses ratio | Combined ratio | |
|---|---|---|---|
Motor | 64.31% | 43.35% | 107.66% |
Engineering | 44.08% | 55.95% | 100.03% |
Marine (1) | 34.23% | 53.47% | 87.70% |
Third party liability | 46.34% | 44.63% | 90.97% |
Property damage (2) | 44.43% | 50.67% | 95.10% |
Personal accident | 32.57% | 60.20% | 92.77% |
Health | 75.61% | 27.36% | 102.97% |
Miscellaneous (3) | 42.10% | 45.48% | 87.58% |
| Total non-life | 62.50% | 39.96% | 102.46% |
(1) including aviation
(2) including theft and fire
(3) including workmen’s compensation
Source: Insurance Regulatory Authority of Kenya, IRA
- Vous devez vous identifier ou créer un compte pour écrire des commentaires
