Swiss Reinsurance Company Group
 | Date of creation: 19 December 1863, Zurich, Switzerland |
| Classes of business: Life and non-life | |
| Regional presence: Worldwide | |
| Number of employees: 13 200 |
(1) Swiss Reinsurance Company Group includes Swiss Reinsurance Company Ltd (SRZ), the parent company based in Zurich, and 34 subsidiaries and associated companies operating in 17 countries.
Swiss Reinsurance Company Group: contact
| Head office: Mythenquai 50/60, P.O. Box 8022, Zurich, Switzerland |
| Phone: +41 43 285 2121 |
| Fax: +41 43 285 2999 |
| E-mail : media_relations [at] swissre [dot] com |
| Website: www.swissre.com |
Swiss Reinsurance Company Group: rating
| Agency | Rating | Outlook |
| Standard & Poor's | AA- | Negative |
| A.M. Best | A+ | Stable |
| Moody’s | Aa3 | Stable |
Swiss Reinsurance Company Group: in 2020
Share capital * | 10 072 million USD |
Turnover | 38 623 million USD |
Assets | 164 737 million USD |
Shareholder’s equity | 17 853 million USD |
Net result | -438 million USD** |
Non-life loss ratio | 78.74% |
Non-life management expenses ratio | 30.51% |
Non-life combined ratio | 109.25% |
* Including additional paid-in capital
** After taking into account minority shareholdings
Read also | Swiss Re: net profit in Q1 2021
Swiss Reinsurance Company Group: management
 |  |
Sergio P. Ermotti Chairman of the Board of Directors | Christian Mumenthaler CEO |
| Sergio P. Ermotti | Chairman of the Board of Directors |
| Christian Mumenthaler | Group CEO |
| Andreas Berger | CEO Corporate Solutions |
| Anette Bronder | Chief Operating Officer |
| John R. Dacey | Chief Financial Officer |
| Urs Baertschi | CEO of EMEA Reinsurance and EMEA Head of Operations |
| Moses Ojeisekhoba | Reinsurance CEO |
Read also | Swiss Re: new appointments
Swiss Reinsurance Company Group: Shareholding as at 31/12/2020
| Shareholding | In % |
| Institutional shareholders | 62.0% |
| Individual shareholders | 23.9% |
| Swiss Re employees | 4.1% |
Swiss Reinsurance Company Group: main technical highlights
Figures in millions USD| Highlights | 2016 | 2017 | 2018 | 2019 | 2020 |
|---|---|---|---|---|---|
Gross written premiums | 31 667 | 30 009 | 31 182 | 36 642 | 38 623 |
* Non-life gross written premiums | 18 173 | 16 569 | 16 545 | 21 562 | 21 512 |
* Life and health gross written premiums | 12 801 | 13 313 | 14 527 | 14 452 | 15 067 |
* Other operations | 693 | 127 | 110 | 628 | 2 044 |
Net written premiums | 29 715 | 27 863 | 28 746 | 34 750 | 36 336 |
Net non-life written premiums | 17 768 | 16 031 | 16 098 | 20 882 | 20 636 |
Earned premiums | 28 993 | 28 525 | 28 778 | 33 165 | 35 842 |
Non-life earned premiums | 17 008 | 16 667 | 16 095 | 19 275 | 20 832 |
Incurred losses | 10 299 | 13 172 | 11 614 | 14 782 | 16 593 |
Non-life incurred losses | 10 301 | 13 172 | 11 614 | 14 783 | 16 403 |
Management expenses | 8 855 | 8 691 | 8 209 | 9 322 | 9 924 |
Non-life management expenses | 5 609 | 5 412 | 5 126 | 5 999 | 6 297 |
Non-life loss ratio (1) | 60.57% | 79.03% | 72.16% | 76.70% | 78.74% |
Non-life management expenses ratio (2) | 31.57% | 33.76% | 31.84% | 28.73% | 30.51% |
Non-life combined ratio (3) | 92.14% | 112.79% | 104.00% | 105.43% | 109.25% |
Net result after taxes (4) | 3 111 | -1 | 970 | 998 | -438 |
(1) Non-life loss ratio = Non-life incurred losses / non-life earned premiums
(2) Non-life management expenses ratio = Non-life management expenses / Net non-life written premiums
(3) Non-life combined ratio = Non-life loss ratio + Non-life management expenses ratio
(4) After taking into account minority shareholdings
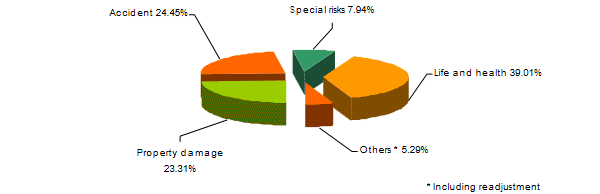
Swiss Reinsurance Company Group: turnover breakdown per class of business
Figures in millions USD| Class of business | 2016 | 2017 | 2018 | 2019 | 2020 | 2020 shares |
|---|---|---|---|---|---|---|
Accident | 8 874 | 7 715 | 7 595 | 10 497 | 9 445 | 24.45% |
Property damage | 6 815 | 6 527 | 6 403 | 7 927 | 9 001 | 23.31% |
Special risks | 2 484 | 2 327 | 2 547 | 3 138 | 3 066 | 7.94% |
Total non-life | 18 173 | 16 569 | 16 545 | 21 562 | 21 512 | 55.70% |
Life and health | 12 801 | 13 313 | 14 527 | 14 452 | 15 067 | 39.01% |
Other operations | 997 | 127 | 110 | 1 561 | 2 314 | 5.99% |
Readjustment | -304 | - | - | -933 | -270 | -0.70% |
| Grand total | 31 667 | 30 009 | 31 182 | 36 642 | 38 623 | 100% |
Breakdown of 2020 turnover per class of business
Swiss Reinsurance Company Group: net written premiums per class of business
Figures in millions USD| Class of business | 2016 | 2017 | 2018 | 2019 | 2020 | 2019-2020 evolution |
|---|---|---|---|---|---|---|
Accident | 8 833 | 7 665 | 7 548 | 10 452 | 9 364 | -10.41% |
Property damage | 6 499 | 6 115 | 6 047 | 7 329 | 8 278 | 12.95% |
Special risks | 2 436 | 2 251 | 2 503 | 3 101 | 2 994 | -3.45% |
Total non-life | 17 768 | 16 031 | 16 098 | 20 882 | 20 636 | -1.18% |
Life and health | 11 459 | 11 826 | 12 647 | 12 734 | 13 657 | 7.25% |
Other operations | 488 | 6 | 1 | 1 134 | 2 043 | 80.16% |
| Grand total | 29 715 | 27 863 | 28 746 | 34 750 | 36 336 | 4.56% |
Swiss Reinsurance Company Group: earned premiums per class of business
Figures in millions USD| Class of business | 2016 | 2017 | 2018 | 2019 | 2020 | 2019-2020 evolution |
|---|---|---|---|---|---|---|
Accident | 8 003 | 8 100 | 7 664 | 9 286 | 9 609 | 3.48% |
Property damage | 6 652 | 6 255 | 6 029 | 7 207 | 8 250 | 14.47% |
Special risks | 2 353 | 2 312 | 2 402 | 2 782 | 2 973 | 6.87% |
| Total non-life | 17 008 | 16 667 | 16 095 | 19 275 | 20 832 | 8.08% |
| Life and health | 11 486 | 11 851 | 12 683 | 12 835 | 13 725 | 6.93% |
| Other operations | 499 | 7 | - | 1 055 | 1 285 | 21.80% |
| Grand total | 28 993 | 28 525 | 28 778 | 33 165 | 35 842 | 8.07% |
Swiss Reinsurance Company Group: non-life incurred losses per class of business
Figures in millions USD| Class of business | 2016 | 2017 | 2018 | 2019 | 2020 | 2019-2020 evolution |
|---|---|---|---|---|---|---|
Accident | 5 466 | 6 041 | 5 860 | 7 675 | 7 570 | -1.37% |
Property damage | 3 745 | 5 635 | 4 284 | 5 328 | 6 785 | 27.35% |
Special risks | 1 090 | 1 496 | 1 470 | 1 780 | 2 048 | 15.06% |
| Total | 10 301 | 13 172 | 11 614 | 14 783 | 16 403 | 10.96% |
Swiss Reinsurance Company Group: non-life management expenses per class of business
Figures in millions USD| Class of business | 2016 | 2017 | 2018 | 2019 | 2020 | 2019-2020 evolution |
|---|---|---|---|---|---|---|
Accident | 2 853 | 2 770 | 2 616 | 3 153 | 3 172 | 0.60% |
Property damage | 2 016 | 1 864 | 1 736 | 1 975 | 2 241 | 13.47% |
Special risks | 740 | 778 | 774 | 871 | 884 | 1.49% |
| Total | 5 609 | 5 412 | 5 126 | 5 999 | 6 297 | 4.97% |
Swiss Reinsurance Company Group: non-life loss ratio per class of business
| Class of business | 2016 | 2017 | 2018 | 2019 | 2020 |
|---|---|---|---|---|---|
Accident | 68.30% | 74.58% | 76.46% | 82.65% | 78.78% |
Property damage | 56.30% | 90.09% | 71.06% | 73.93% | 82.24% |
Special risks | 46.32% | 64.71% | 61.20% | 63.98% | 68.89% |
| Total non-life | 60.57% | 79.03% | 72.16% | 76.70% | 78.74% |
Swiss Reinsurance Company Group: non-life management expenses ratio per class of business
| Class of business | 2016 | 2017 | 2018 | 2019 | 2020 |
|---|---|---|---|---|---|
Accident | 32.30% | 36.14% | 34.66% | 30.17% | 33.87% |
Property damage | 31.02% | 30.48% | 28.71% | 26.95% | 27.07% |
Special risks | 30.38% | 34.56% | 30.92% | 28.09% | 29.53% |
| Total non-life | 31.57% | 33.76% | 31.84% | 28.73% | 30.51% |
Swiss Reinsurance Company Group: Non-life combined ratios per class of business
| Class of business | 2016 | 2017 | 2018 | 2019 | 2020 |
|---|---|---|---|---|---|
Accident | 100.60% | 110.72% | 111.12% | 112.82% | 112.65% |
Property damage | 87.32% | 120.57% | 99.77% | 100.88% | 109.31% |
Special risks | 76.70% | 99.27% | 92.12% | 92.07% | 98.42% |
| Total non-life | 92.14% | 112.79% | 104.00% | 105.43% | 109.25% |