10 years of insurance premiums
Evolution of the overall premiums in Africa: 2002-2011
in millions USD| 2002 | 2003 | 2004 | 2005 | 2006 | 2007 | 2008 | 2009 | 2010 | 2011 | 2002/11 evolution | |
|---|---|---|---|---|---|---|---|---|---|---|---|
South Africa | 19 575 | 25 398 | 29 700 | 34 773 | 40 743 | 42 775 | 40 371 | 44 835 | 48 575 | 52 376 | 167.5% |
Nigeria | 388 | 422 | 452 | 609 | 712 | 939 | 976 | 982 | 1 340 | 1 557 | 301.3% |
Kenya | 369 | 411 | 412 | 481 | 575 | 713 | 798 | 833 | 998 | 1 036 | 180.7% |
Angola | 129 | 198 | 305 | 512 | 680 | 949 | 513 | 555 | 828 | 1 000 | 675.2% |
Namibia | 321 | 354 | 454 | 491 | 563 | 601 | 629 | 730 | 887 | 971 | 202.4% |
Mauritius | 207 | 241 | 276 | 282 | 318 | 372 | 486 | 451 | 508 | 614 | 196.6% |
Other countries | 1455 | 1789 | 1778 | 2164 | 2472 | 2621 | 3280 | 3097 | 3749 | 3940 | 170.7% |
Total | 22 444 | 28 813 | 33 377 | 39 312 | 46 063 | 48 970 | 47 053 | 51 483 | 56 885 | 61 494 | 174.0% |
| 2002 | 2003 | 2004 | 2005 | 2006 | 2007 | 2008 | 2009 | 2010 | 2011 | 2002/11 evolution | |
|---|---|---|---|---|---|---|---|---|---|---|---|
South Africa | 206 345 | 198 450 | 199 737 | 221 153 | 282 601 | 300 730 | 345 920 | 377 660 | 355 341 | 380 233 | 84.2% |
Nigeria | 46 993 | 50 514 | 61 222 | 79 918 | 85 900 | 105 379 | 157 206 | 189 960 | 200 375 | 233 752 | 397.4% |
Kenya | 25 913 | 29 216 | 32 490 | 36 306 | 41 476 | 48 013 | 55 247 | 64 013 | 76 909 | 91 806 | 254.2% |
Angola | 7 350 | 11 517 | 17 742 | 45 800 | 54 792 | 37 494 | 36 484 | 55 081 | 76 054 | 93 500 | 1172% |
Namibia | 2 709 | 2 681 | 2 935 | 3 117 | 4 011 | 4 393 | 5 447 | 6 186 | 6 491 | 7 973 | 194.3% |
Mauritius | 6 203 | 6 872 | 7 603 | 9 054 | 10 509 | 11 647 | 13 826 | 14 745 | 17 537 | 19 200 | 209.5% |
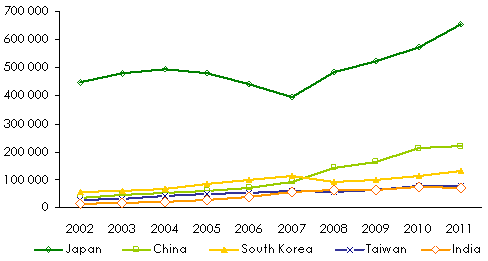
Evolution of the overall premiums of some Asian countries: 2002-2011
in millions USD| 2002 | 2003 | 2004 | 2005 | 2006 | 2007 | 2008 | 2009 | 2010 | 2011 | 2002/11 | |
|---|---|---|---|---|---|---|---|---|---|---|---|
Japan | 445 940 | 478 865 | 494 735 | 478 211 | 439 385 | 393 125 | 483 083 | 522 155 | 571 359 | 655 408 | 46.9% |
China | 36 961 | 46 911 | 52 172 | 60 144 | 70 737 | 92 483 | 140 814 | 163 047 | 214 626 | 221 858 | 500.2% |
South Korea | 56 720 | 59 758 | 68 806 | 85 097 | 100 613 | 115 458 | 90 623 | 98 425 | 115 061 | 130 383 | 129.8% |
Taiwan | 28 714 | 32 402 | 42 691 | 48 984 | 51 571 | 60 521 | 55 527 | 63 782 | 76 425 | 78 416 | 173.1% |
India | 14 664 | 17 302 | 21 608 | 27 410 | 40 334 | 57 782 | 64 265 | 64 266 | 74 379 | 72 628 | 395.2% |
Other countries | 42 219 | 46 254 | 53 468 | 58 300 | 66 399 | 82 139 | 87 076 | 87 847 | 103 728 | 121 159 | 184.5% |
Total | 625 218 | 681 492 | 733 480 | 758 146 | 769 039 | 801 508 | 921 388 | 999 522 | 1 155 578 | 1 279 852 | 104.6% |
| 2002 | 2003 | 2004 | 2005 | 2006 | 2007 | 2008 | 2009 | 2010 | 2011 | 2002/11 | |
|---|---|---|---|---|---|---|---|---|---|---|---|
Japan | 54 358 | 53 419 | 53 290 | 54 147 | 51 405 | 44 844 | 48 542 | 48 485 | 48 940 | 51 708 | -4.8% |
China | 305.4 | 388 | 432.3 | 492.8 | 564 | 703.3 | 978.3 | 1 114 | 1 453 | 1 434 | 369.5% |
South Korea | 69 248 | 71 266 | 76 279 | 86 204 | 95 149 | 107 788 | 110 048 | 119 114 | 132 365 | 144 794 | 109.1% |
Taiwan | 990.7 | 1 242 | 1 424 | 1 576 | 1 678 | 1 988 | 2 027 | 2 108 | 2 419 | 2 311 | 133.2% |
India | 709.8 | 833.2 | 970.9 | 1 272 | 1 832 | 2 318 | 2 554 | 3 047 | 3 390 | 3 477 | 389.8% |
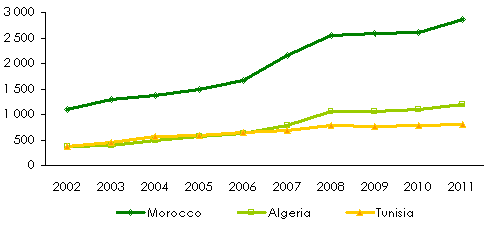
Evolution of the overall premiums in the Maghreb: 2002-2011
in millions USD| 2002 | 2003 | 2004 | 2005 | 2006 | 2007 | 2008 | 2009 | 2010 | 2011 | 2002/2011 evolution | |
|---|---|---|---|---|---|---|---|---|---|---|---|
Morocco | 1 095 | 1 288 | 1 375 | 1 484 | 1 675 | 2 153 | 2 548 | 2 583 | 2 599 | 2 859 | 161.1% |
Algeria | 364 | 399 | 496 | 568 | 625 | 776 | 1 051 | 1 065 | 1 093 | 1 201 | 229.9% |
Tunisia | 379 | 456 | 561 | 594 | 650 | 694 | 781 | 757 | 775 | 812 | 114.2% |
Total | 1 838 | 2 143 | 2 432 | 2 646 | 2 950 | 3 623 | 4 380 | 4 405 | 4 467 | 4 872 | 165.1% |
| 2002 | 2003 | 2004 | 2005 | 2006 | 2007 | 2008 | 2009 | 2010 | 2011 | 2002/2011 evolution | |
|---|---|---|---|---|---|---|---|---|---|---|---|
Morocco | 12 084 | 12 333 | 12 193 | 13 103 | 14 732 | 17 635 | 19 747 | 20 982 | 21 873 | 23 894 | 97.7% |
Algeria | 28 985 | 31 311 | 35 758 | 41 620 | 45 394 | 53 789 | 67 884 | 77 339 | 81 713 | 86 675 | 199% |
Tunisia | 587 | 630 | 697 | 770 | 865 | 877 | 962 | 1 017 | 1 109 | 1 178 | 100.6% |
Evolution of the overall premiums in the Middle East: 2002-2011
in millions USD| 2002 | 2003 | 2004 | 2005 | 2006 | 2007 | 2008 | 2009 | 2010 | 2011 | 2002/11 | |
|---|---|---|---|---|---|---|---|---|---|---|---|
U.A.E | 859 | 971 | 1 575 | 2 140 | 2 808 | 3 973 | 4 976 | 5 456 | 5 970 | 6 641 | 673.1% |
Saudi Arabia | 905 | 941 | 1 143 | 1 412 | 1 852 | 2 290 | 2 912 | 3 896 | 4 370 | 4 971 | 449.2% |
Qatar* | - | 257 | 310 | 462 | 485 | 538 | 846 | 773 | 878 | 961 | 274% |
Lebanon | 469 | 520 | 580 | 664 | 656 | 761 | 881 | 952 | 1 115 | 1 221 | 160.3% |
Kuwait | 311 | 320 | 441 | 527 | 641 | 675 | 670 | 589 | 718 | 812 | 161.1% |
Oman | 248 | 257 | 267 | 293 | 375 | 439 | 542 | 619 | 691 | 766 | 208.8% |
Egypt | 521 | 565 | 613 | 760 | 861 | 1 090 | 1 396 | 1 565 | 1 720 | 1 714 | 228.9% |
Jordan | 207 | 220 | 270 | 309 | 365 | 411 | 469 | 514 | 576 | 622 | 200.4% |
Bahrain | 181 | 210 | 239 | 249 | 299 | 361 | 497 | 533 | 560 | 579 | 219.8% |
Total | 3 701 | 4 261 | 5 438 | 6 816 | 8 342 | 10 538 | 13 189 | 14 897 | 16 598 | 18 287 | 394.1% |
| 2002 | 2003 | 2004 | 2005 | 2006 | 2007 | 2008 | 2009 | 2010 | 2011 | 2002/11 | |
|---|---|---|---|---|---|---|---|---|---|---|---|
U.A.E | 4.1 | 4.8 | 5.8 | 7.9 | 10.3 | 14.6 | 18.3 | 20 | 21.9 | 24.4 | 500% |
Saudi Arabia | 3.4 | 3.7 | 4.3 | 5.2 | 6.9 | 8.6 | 10.9 | 14.6 | 16.4 | 18.6 | 449% |
Qatar* | - | 0.93 | 1.1 | 1.7 | 1.8 | 2.6 | 3.1 | 3.1 | 3.2 | 3.5 | 274% |
Lebanon | 707 | 784 | 874 | 1 001 | 989 | 1 147 | 1 328 | 1 554 | 1 680 | 1 841 | 160% |
Kuwait | 0.09 | 0.11 | 0.13 | 0.15 | 0.19 | 0.18 | 0.18 | 0.17 | 0.21 | 0.22 | 117% |
Oman | 0.09 | 0.1 | 0.1 | 0.12 | 0.14 | 0.16 | 0.21 | 0.24 | 0.25 | 0.28 | 195% |
Egypt | 2.2 | 2.8 | 3.7 | 4.5 | 4.9 | 6.2 | 7.6 | 8.6 | 9.4 | 9.9 | 343% |
Jordan | 0.15 | 0.17 | 0.19 | 0.22 | 0.26 | 0.29 | 0.33 | 0.36 | 0.41 | 0.44 | 203% |
Bahrain | 0.07 | 0.08 | 0.09 | 0.09 | 0.11 | 0.14 | 0.19 | 0.2 | 0.21 | 0.21 | 216% |
Evolution of the overall premiums of some OECD countries: 2002-2011
in billions USD| 2002 | 2003 | 2004 | 2005 | 2006 | 2007 | 2008 | 2009 | 2010 | 2011 | 2002/11 | |
|---|---|---|---|---|---|---|---|---|---|---|---|
USA | 1 005 | 1 055 | 1 109 | 1 110 | 1 174 | 1 237 | 1 239 | 1 149 | 1 162 | 1 204 | 19.8% |
UK | 236 | 246 | 292 | 336 | 361 | 539 | 395 | 312 | 300 | 319 | 34.9% |
France | 125 | 163 | 199 | 220 | 250 | 272 | 275 | 284 | 283 | 273 | 118.2% |
Germany | 135 | 170 | 190 | 197 | 202 | 223 | 241 | 239 | 234 | 245 | 80.5% |
Italy | 84 | 111 | 128 | 141 | 140 | 142 | 140.6 | 169 | 174 | 160 | 90.9% |
Canada | 48.4 | 59.1 | 69.9 | 78.1 | 87.6 | 100.8 | 104.3 | 99.4 | 113.7 | 121.2 | 150.2% |
Total | 1 636 | 1 807 | 1 990 | 2 084 | 2 217 | 2 516 | 2 398 | 2 254 | 2 268 | 2 324 | 42% |
Rest of the world | 343 | 416 | 498 | 554 | 631 | 746 | 835 | 784 | 833 | 906 | 164.2% |
Total world | 2 632 | 2 940 | 3 264 | 3 445 | 3 674 | 4 127 | 4 220 | 4 109 | 4 335 | 4 595 | 74.5% |
| 2002 | 2003 | 2004 | 2005 | 2006 | 2007 | 2008 | 2009 | 2010 | 2011 | 2002/11 | |
|---|---|---|---|---|---|---|---|---|---|---|---|
USA | 1 006 | 1 055 | 1 109 | 1 110 | 1 175 | 1 238 | 1 240 | 1 150 | 1 162 | 1 205 | 19.8% |
UK | 158 | 158 | 160 | 178 | 214 | 269 | 214 | 199 | 194 | 199 | 26.4% |
France | 133 | 145 | 159 | 178 | 199 | 198 | 188 | 204 | 214 | 196 | 47.6% |
Germany | 144 | 150 | 153 | 159 | 161 | 163 | 164 | 172 | 177 | 176 | 22.1% |
Italy | 89.8 | 99.1 | 103 | 113 | 111 | 103 | 95.6 | 121 | 131 | 115 | 28.3% |
Canada | 77.3 | 84.4 | 88.8 | 94.6 | 100 | 108 | 111 | 113 | 117 | 120 | 55.1% |