ACE Group

It all started in 1985, when ACE Limited and its subsidiary “ACE Bermuda” were set up in Hamilton (Bermuda) by a consortium of 34 companies. Initially, the group had as main objective to fill in the lack of capacity in third party liability insurance, particularly the one applying to directors and officers.
Starting out as a simple mono-line insurer, ACE managed in less than three decades to undergo successive periods of consolidation and expansion, becoming a market’s giant.
 |  |
| Evan Greenberg | John Keogh |
| Chairman and CEO | Vice-chairman |
ACE Group in 2012
| Capital | 32.600 billion USD |
| Turnover | 21.593 billion USD |
| Total assets | 92.545 billion USD |
| Shareholder's equity | 27.531 billion USD |
| Rank | 6th global insurer for P&C insurance |
| Net profit | 2.706 billion USD |
| Combined ratio | 89.8% |
| Number of subsidiaries & representation offices | 54 |
| Number of employees | 19 000 |
| Territorial scope | 170 countries |
Management
| Chairman and CEO | Evan Greenberg |
| Vice chairman, Chief Operating Officer & chairman of Overseas General insurance segment | John Keogh |
| Chairman of North America insurance segment | John Lupica |
| Chairman of the Reinsurance segment (ACE Tempest Re Group) | Jacques Bonneau |
| Chairman of ACE Life | Russell Bundschuh |
| Chairman of the Life segment & executive vice- president of Accident & Health and Life | Edward Clancy |
Main shareholders
| BlackRock, Inc. | 7.56% |
| Capital World Investors | 7.50% |
| Wellington Management Company | 6.99% |
| FMR LLC | 5.46% |
ACE Group: main highlights
Various steps and acquisitions have marked this exceptional course.
| Years | Events |
|---|---|
1985 | Establishment of ACE, Hamilton (Bermuda). ACE Bermuda underwrote its first policy. |
1986 | Opening of the first office in Hamilton with six employees. |
1993 | Getting listed in the New York Stock Exchange. Purchase of Corporate Officers & Directors Assurance (CODA). |
1996 | Acquisition of the reinsurer Tempest Re (Bermuda) and two management agencies belonging to Lloyd's : Ockham Worldwide and Methuen Underwriting. |
1997 | Establishment of Sovereign Risk Insurance, which specializes in underwriting political risks Ace began started operating in Europe from Ireland. |
1998 | Acquisition of Westchester Fire Insurance Company (United States), CAT Limited (United States) and Tarquin Ltd ( United Kingdom). Establishment of ACE Global Markets. |
1999 | Acquisition of CIGNA (United States) for 3.45 billion USD and Capital Re (United States). |
2000 | Purchase of 51% of Egyptian American Insurance Company (EAIC)’s capital. |
2002 | Strategic partnership with China's Huatai Insurance Company. Establishment of ACE European Group headquarters in London. |
2003 | Establishment of ACE Captive Solutions, ACE Risk Management International, ACE Financial Solutions Europe and ACE Financial Reinsurance Europe. |
2005 | License granted to market life insurance in China, Vietnam and non-life insurance in Russia and Poland. |
2006 | Opening of an office in South Africa and the acquisition of Hart Life Insurance (U.S.A). |
2007 | Opening of a branch in Vietnam and Hungary and the Czech Republic. Starting ofinsurance operations in Bahrain. |
2008 | Transfer of ACE headquarters to Zurich (Switzerland). Takeover of Combined Insurance Company of America. |
2009 | Opening of an office in Turkey. |
2010 | Acquisition of Rain and Hail Insurance Services, Jerneh Insurance Berhad (Malaysia). |
2011 | Purchase of the life portfolio of New York Life in Korea and Hong Kong. Acquisition of Penn Millers (American insurer specializing in agriculture) and Rio Guayas (Ecuador). Opening of a representation office in Dubai International Financial Centre. |
2012 | Acquisition of 80% stake in Asuransi Jaya Proteksi (Indonesia). Opening of an office in Ukraine. |
2013 | Acquisition of two Mexican insurers ABA Seguros and Fianzas Monterrey. Opening of an office in Tunis (Tunisia). |
Ratings
Agencies | Ratings | Outlooks |
|---|---|---|
Standard & Poor’s | AA- | Positive |
A.M. Best | A+ | Positive |
Fitch Ratings | AA | Stable |
Moody’s | Aa3, A1 | Stable |
Group’s structure
Ace provides a variety of insurance and reinsurance products and a range of services across various operating units.
The group's activity is centered around four poles.
- Insurance - North America: The North American segment gathers the companies ACE USA, ACE Agriculture, ACE Westchester, ACE Bermuda, ACE Private Risk Services and ACE Commercial Risk Services.
- Insurance - Overseas: entity entrusted with the marketing of a wide range of non-life products designed for corporate and individuals in more than 50 countries outside North America. This pole consists of three entities:
- ACE International which is organized around four areas: Pacific Asia, Latin America, the Far East and EMEA (Europe, Middle East and Africa).
- Combined Insurance, a member company of the group since 2008, provides additional and customized insurance products designed for middle income consumers in Europe, Latin America and Pacific Asia.
- ACE Global Markets, an entity which provides additional capacity for non-life, accident and health business from the London market. It operates through ACE Underwriting Agencies (Lloyd's Syndicate 2488) and ACE European Group.
- Reinsurance: The reinsurance activity is provided by ACE Tempest Re, a unit that includes four entities: ACE Tempest Re Bermuda, ACE Tempest Re USA, ACE Tempest Re Canada and ACE Tempest Re International which includes non-life reinsurance (Property & Casualty) operations based in London, Sao Paulo and Zurich. Ace Tempest Re is also present in Brazil and China through Lloyd's.
- Life, through ACE Life, an entity in charge of the management and marketing of life business which consists of two companies: ACE Life for direct insurance and Ace Tempest Life Re, providing life reinsurance solutions.
ACE in the Middle East and Africa
The Middle East and Africa portfolio is managed by ACE European Group. Based in London, this entity employs 2 600 people and operates in 28 countries including five in the Middle East (Bahrain, Egypt, Saudi Arabia, Pakistan and the United Arab Emirates) and two in Africa (South Africa and Tunisia). Established in 2008 in Bahrain, the ACE MENA regional office coordinates the non-life activity in the Middle East and North Africa while providing technical assistance services. This office is headed by Steve Dixon who is in charge of the Middle East and Africa region.
Presence of ACE in Africa
The group’s presence in Africa dates back to 1999, when the South African portfolio of the American insurer, CIGNA, was acquired. The establishment of ACE South Africa has been in effect since July 2006.
In September 2013, a new branch was opened in Africa. Based in Tunis (Tunisia), this 54 th regional entity covers all the Maghreb countries and underwrites a wide range of reinsurance facultative risks. It is run by Kamal Kaabi.
Presence of ACE in the Middle East and Africa
| Country | Company or subsidiary name | Date of establishment |
|---|---|---|
Bahrain | ACE American Insurance Company Bahrain Branch | Creation in 2008 |
Egypt | ACE Insurance Company Egypt | Creation in 2001 CEO: Ghassan Wazen |
Pakistan | ACE Insurance Limited | Purchase in 1999 of the company CIGNA |
Saudi Arabia | ACE Arabia Cooperative Insurance Company | Purchase in 1999 of the company CIGNA |
Dubai, U.A.E | ACE Insurance Management (DIFC) | Establishment in 2011 of a representation office in Dubai International Financial Centre |
South Africa | ACE South Africa | Creation in 2006 |
Tunisia | ACE American Insurance Company Tunisia Branch | Creation in 2013 Manager: Kamal Kaabi |
Main technical higlights: 2008 - 2012
in millions USD
| 2008 | 2009 | 2010 | 2011 | 2012 | |
|---|---|---|---|---|---|
Gross written premiums | 19 242 | 19 164 | 19 511 | 20 831 | 21 593 |
Written premiums net of reinsurance | 13 080 | 13 299 | 13 708 | 15 372 | 16 075 |
Net earned premiums | 13 203 | 13 240 | 13 504 | 15 387 | 15 677 |
Net incurred losses | 7 603 | 7 422 | 7 579 | 9 520 | 9 653 |
Management expenses | 1 737 | 1 811 | 1 873 | 2 068 | 2 096 |
Commissions | 2 135 | 2 130 | 2 345 | 2 472 | 2 446 |
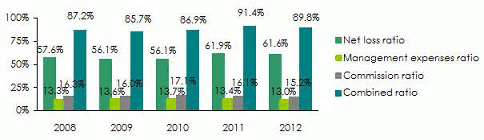
Management expenses ratio | 13.3% | 13.6% | 13.7% | 13.4% | 13.0% |
Commission ratio | 16.3% | 16.0% | 17.1% | 16.1% | 15.2% |
Net loss ratio | 57.6% | 56.1% | 56.1% | 61.9% | 61.6% |
Combined ratio | 87.2% | 85.7% | 86.9% | 91.4% | 89.8% |
Net investment income | 2 062 | 2 031 | 2 070 | 2 242 | 2 181 |
Net result | 1 197 | 2 549 | 3 085 | 1 540 | 2 706 |
Evolution of premiums, losses and results
in millions USD 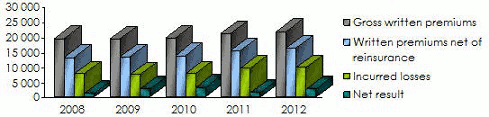
Evolution of ratios
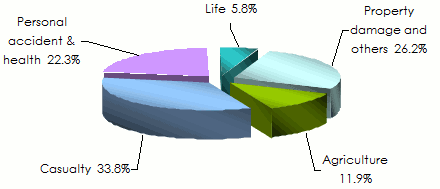
Breakdown of net earned premiums per class of business: 2008-2012
in millions USD
| 2008 | 2009 | 2010 | 2011 | 2012 | 2012 shares | 2011/012 | |
|---|---|---|---|---|---|---|---|
Property damage & others | 3 954 | 4 023 | 3 500 | 3 770 | 4 101 | 26.2% | 8.8% |
Agriculture | - | - | 398 | 1 942 | 1 872 | 11.9% | -3.6% |
Casualty | 5 838 | 5 587 | 5 752 | 5 340 | 5 292 | 33.8% | -0.9% |
Total non life | 9 792 | 9 610 | 9 650 | 11 052 | 11 265 | 71.9% | 1.9% |
Personal accident & health | 2 949 | 3 103 | 3 243 | 3 471 | 3 499 | 22.3% | 0.8% |
Life | 462 | 527 | 611 | 864 | 913 | 5.8% | 5.7% |
Total life | 3 411 | 3 630 | 3 854 | 4 335 | 4 412 | 28.1% | 1.8% |
Grand total | 13 203 | 13 240 | 13 504 | 15 387 | 15 677 | 100% | 1.9% |
Breakdown of net earned premiums per class of business in 2012
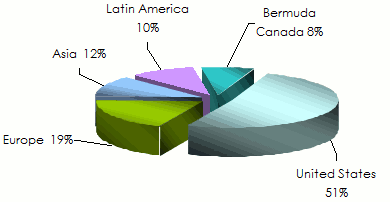
Breakdown of gross written premiums per region in 2012
Breakdown of premiums per segment of activity and per class of business in 2012
in millions USD
| North America | % | Overseas insurance | % | Life 1 | % | Reinsurance | % | Group’s total | % | |
|---|---|---|---|---|---|---|---|---|---|---|
Property damage & others | 3 242 | 54.3% | 2 236 | 37.4% | - | - | 495 | 8.3% | 5 973 | 100% |
Casualty | 3 406 | 64.4% | 1 379 | 26.1% | - | - | 507 | 9.5% | 5 292 | 100% |
Life | 371 | 8.4% | 2 125 | 48.2% | 1 916 | 43.4% | - | 0.0% | 4 412 | 100% |
Total | 7 019 | 44.8% | 5 740 | 36.6% | 1 916 | 12.2% | 1 002 | 6.4% | 15 677 | 100% |
1 including life, accident and health.
Main indicators per segment of activity in 2012
in millions USD
| North America | % | Overseas insurance | % | Life 1 | % | Reinsurance | % | Corporate & others | % | Group’s total | % | |
|---|---|---|---|---|---|---|---|---|---|---|---|---|
Written premiums net of reinsurance | 7 208 | 44.8% | 5 863 | 36.5% | 1 979 | 12.3% | 1 025 | 6.4% | - | - | 16 075 | 100% |
Net earnedpremiums | 7 019 | 44.8% | 5 740 | 36.6% | 1 916 | 12.2% | 1 002 | 6.4% | - | - | 15 677 | 100% |
Incurred losses | 5 626 | 58.3% | 2 862 | 29.6% | 611 | 6.3% | 553 | 5.7% | 1 | 0.1% | 9 653 | 100% |
Managementexpenses | 601 | 28.7% | 935 | 44.6% | 328 | 15.6% | 51 | 2.4% | 181 | 8.6% | 2 096 | 100% |
Commissions | 586 | 24.0% | 1 353 | 55.3% | 334 | 13.6% | 172 | 7.0% | 1 | 0.1% | 2 446 | 100% |
Managementexpenses ratio | 8.3% | - | 15.9% | - | 16.6% | - | 5.0% | - | 13.0% | |||
Commission ratio | 8.1% | - | 23.1% | - | 16.9% | - | 16.8% | - | 15.2% | |||
Net loss ratio | 80.2% | - | 49.9% | - | 31.9% | - | 55.2% | - | 61.6% | |||
Combined ratio | 96.6% | - | 88.9% | - | 65.3% | - | 76.9% | - | 89.8% | |||
Net investment income | 1 091 | 50.0% | 521 | 23.9% | 251 | 11.5% | 290 | 13.3% | 28 | 1.3% | 2 181 | 100% |
Net result | 1 136 | 42.0% | 1 073 | 39.7% | 235 | 8.7% | 518 | 19.1% | -256 | -9.5% | 2 706 | 100% |
Contact
| Headquarters | Bärengasse 32, 8001 Zurich, Switzerland |
| Tel | (+41) 0 43 456 7600 |
| Website |