


Appendix I |
|---|
Africa Re: Regional offices
| Country | Address | Date of creation |
|---|---|---|
| Morocco | Casablanca regional office 33 Boulevard Moulay Youssef . B.P. 7556 Casablanca. Morocco Phone: (212) 22 43 77 00 - 5 Fax: (212) 22 43 77 29 -30 E-mail:casablanca@africa-re.com | 1980 |
| Nigeria | Lagos regional office Plot 1679. KarimuKotun Street Victoria Island. P.M.B. 12765 Lagos - Nigeria Phone: (234 -1) 461 6820. 28 000 78 Fax: (234 -1) 28 000 74 E-mail:lagos@africa-re.com | 1981 |
| Kenya | Nairobi regional office Africa Re Centre. Hospital Road. Upper Hill. Nairobi - Kenya P.O. Box 62328 - 00200. Nairobi Phone: ( 254-20) 297 -0000 Fax: (254-20) 297 -0666. 297 -0777 E-mail:nairobi@africa-re.com | 1982 |
| Côte d'Ivoire | Abidjan regional office Rue. Viviane A24 - Cocody. 20 B.P. 1623 Abidjan 20. Côte d'Ivoire Phone : (225 ) 22404480 / 75 Fax: (225) 22404482 E-mail:abidjan@africa-re.com | 1987 |
| Mauritius | Ebene regional offices 11th Floor. One Cybercity. Ebene Port Louis. Mauritius Phone: (230) 454-7074 Fax: (230) 454-7067 E-mail: p.louis@africa-re.com | 2003 |
| Egypt | Cairo regional office 7. Elkhalily Str. Plot No. 1149 Masaken Sheraton. Heliopolis Postal Code: 11361 Cairo. Egypt Phone: (202) 2268566 8 Fax: (202) 22685667 E-mail:cairo @africa-re.com | 2004 |
Africa Re: Subsidiaries
| Country | Address | Date of creation |
|---|---|---|
| South Africa | Johannesburg subsidiary. South Africa 2nd Floor (West Wing) Oakhurst Building 11-13 St. Andrews Rd. Parktown P.O. Box 3013. Houghton 2041 Johannesburg South Africa | 2004 |
| Egypt | Africa Retakaful 7. Elkhalily Str. Plot No. 1149 Masaken Sheraton. Heliopolis Postal Code: 11361 Cairo. Egypt Phone: (202) 2268566 8 Fax: (202) 22685667 E-mail:cairo@africa-re.com | 2010 |
Africa Re: Contact office
| Country | Address | Creation date |
|---|---|---|
Ethiopia | Addis Ababa contact office Debrezeit Road. Beklobet Kirkos Sub City. Kebele 05 Garad Mall 6th floor. Ho. No. 432-6/7 P.O.Box 1055 Addis Ababa | 2011 |
Appendix II |
|---|
Africa Re: The Member States
| Country | Accession date | % |
|---|---|---|
| Algeria | 1976 | 1.33% |
| Angola | 1989 | 0.59% |
| Benin | 1976 | 0.42% |
| Burkina Faso | 1976 | 0.40% |
| Burundi | 1976 | 0.23% |
| Cameroon | 1976 | 1.10% |
| Central African Republic | 1976 | 0.24% |
| Chad | 1976 | 0.40% |
| Congo | 1976 | 0.30% |
| Democratic Republic of Congo | 1976 | 0.63% |
| Côte d’Ivoire | 1977 | 0.56% |
| Egypt | 1976 | 4.04% |
| Eritrea | 1993 | 0.23% |
| Ethiopia | 1976 | 0.94% |
| Gabon | 1976 | 0.44% |
| Gambia | 1976 | 0.63% |
| Ghana | 1976 | 1.04% |
| Guinea | 1976 | 0.37% |
| Guinea Bissau | 1976 | 0.18% |
| Kenya | 1977 | 0.23% |
| Liberia | 1982 | 0.24% |
| Libya | 1976 | 1.33% |
| Madagascar | 1976 | 0.61% |
| Mali | 1976 | 0.32% |
| Mauritania | 1976 | 0.44% |
| Mauritius | 1976 | 0.31% |
| Morocco | 1977 | 3.12% |
| Niger | 1976 | 0.23% |
| Nigeria | 1976 | 6.33% |
| Rwanda | 1989 | 0.23% |
| Senegal | 1977 | 0.55% |
| Seychelles | 1989 | 0.23% |
| Sierra Leone | 1976 | 0.30% |
| Somalia | 1976 | 0.27% |
| Sudan | 1977 | 0.88% |
| Swaziland | 1976 | 0.25% |
| Tanzania | 1976 | 0.54% |
| Togo | 1976 | 0.25% |
| Tunisia | 1976 | 0.56% |
| Uganda | 1977 | 0.60% |
| Zambia | 1977 | 0.76% |
Total | 33.59% | |
Africa Re: Non African shareholders
| Country | Shareholder | Accession date | % |
|---|---|---|---|
| France | Axa Africa Holding | February. 2015 | 7.15% |
| Canada | Fairfax Financial Holding | March. 2015 | 7.15% |
| France | Proparco Groupe Agence Française de Développement | October. 2005 | 2.92% |
| Brazil | IRB-Brasil Resseguros | October. 2012 | 8.17% |
Total | 25.39% | ||
Africa Re: African shareholders
| Shareholder | Accession date | % |
|---|---|---|
| African Development Bank (ADB) | 1976 | 8 .17% |
| Country | Shareholder | Accession date | % | |
|---|---|---|---|---|
| 1 | Algeria | Compagnie Algérienne d’Assurances et de Réassurance (CAAR) | 1990 | 1.26% |
| 2 | Compagnie Algérienne des Assurances (CAAT) | 1990 | 1.26% | |
| 3 | Société Nationale d’Assurance (SAA) | 1990 | 1.26% | |
| 4 | Compagnie Centrale de Réassurance (CCR) | 1990 | 3.05% | |
| 5 | Angola | ENSA Seguros d’Angola (ENSA) | 1990 | 1.02% |
| 6 | Benin | Nouvelle Société Interafricaine d’Assurance (NSIA) | 1990 | 0.08% |
| 7 | Nouvelle Société Interafricaine d’Assurance Vie (NSIA VIE) | 2011 | 0.16% | |
| 8 | Africaine des Assurances | ND | 0.07% | |
| 9 | Burkina Faso | Union des Assurances du Burkina IARDT (UAB) | 1990 | 0.10% |
| 10 | Société Nationale d’Assurance et de Réassurance (SONAR) | 1990 | 0.13% | |
| 11 | Allianz Burkina | 1992 | 0.10% | |
| 12 | Générale Des Assurances (GAB) | 1992 | 0.04% | |
| 13 | Burundi | Société Générale d’Assurance et de Réassurance (SOGEAR) | 1990 | 0.02% |
| 14 | Burundi Insurance Corporation (BICOR) | 1990 | 0.05% | |
| 15 | Société d’Assurances du Burundi (SOCABU) | 1990 | 0.24% | |
| 16 | Cameroon | Société Africaine d’Assurances et de Réassurance (SAAR) | 1990 | 0.08% |
| 17 | SAHAM Assurances | 1990 | 0.05% | |
| 18 | ACTIVA Assurances | 1990 | 0.23% | |
| 19 | ACTIVA VIE Assurances | 2012 | 0.05% | |
| 20 | CHANAS Assurances | 1990 | 0.75% | |
| 21 | AXA Cameroun | 2013 | 0.03% | |
| 22 | Chad | STAR Nationale | 1990 | 0.06% |
| 23 | Congo | Assurances Générales du Congo (AGC) | NA | 0.14% |
| 24 | Nouvelle Société Interafricaine d’Assurance Congo (NSIA CONGO) | 2013 | 0.03% | |
| 25 | Nouvelle Société Interafricaine d’Assurance Vie Congo (NSIA VIE CONGO) | 2013 | 0.01% | |
| 26 | DR of Congo | Société Nationale d’Assurance (SONAS) | 1990 | 0.05% |
| 27 | Côte d’Ivoire | Mutuelle d’Assurance des Taxis Compteurs d’Abidjan (MATCA) | 1990 | 0.10% |
| 28 | Société Mutuelle d’Assurance Vie (SOMAVIE) | N.D | 0.10% | |
| 29 | Société Ivoirienne d’Assurance Mutuelle (SIDAM) | 1990 | 0.10% | |
| 30 | Société Atlantique Assurance Vie (STAMVIE) | 1990 | 0.10% | |
| 31 | Nouvelle Société Interafricaine d’Assurance, Côte d’Ivoire (NSIA CI) | 1990 | 0.24% | |
| 32 | Nouvelle Société Interafricaine d’Assurance Vie (NSIA VIE) | 1990 | 0.25% | |
| 33 | Sunu Assurances IARD Côte d'Ivoire | 1990 | 0.08% | |
| 34 | Garantie Cautionnement des Transports de Côte d’Ivoire (GMTCI) | 1990 | 0.01% | |
| 35 | Amsa Assurances | 1990 | 0.03% | |
| 36 | Allianz Côte d’Ivoire | 1990 | 0.07% | |
| 37 | Axa Côte d’Ivoire | 2013 | 0.03% | |
| 38 | Egypt | Misr Insurance Company | 1990 | 2.38% |
| 39 | Misr Life Insurance Company | 2010 | 1.78% | |
| 40 | Mohandes Insurance Company | 1990 | 0.20% | |
| 41 | Eritrea | National Insurance Corporation of Eritrea (NICE) | 1990 | 0.39% |
| 42 | Ethiopia | Ethiopian Insurance Corporation (EIC) | 1990 | 0.80% |
| 43 | Gabon | Omnium Gabonais d’Assurances et de Réassurances (OGAR/OGARVIE) | 1990 | 0.14% |
| 44 | Nouvelles Société Interafricaine d’Assurances du Gabon (NSIA GABON) | 1990 | 0.04% | |
| 45 | Axa Gabon | 2013 | 0.03% | |
| 46 | Ghana | State Insurance Corporation of Ghana | 1990 | 0.20% |
| 47 | Ghana Reinsurance Corporation | 1990 | 0.20% | |
| 48 | Enterprise Insurance Company (GH) LTD | 1990 | 0.01% | |
| 49 | Ghana Union Assurance Company LTD | 1990 | 0.04% | |
| 50 | Guinea | Union Guinéenne d’Assurances et de Réassurances (UGAR) | 1990 | 0.12% |
| 51 | Kenya | Jubilee Insurance Company of Kenya LTD | 1990 | 0.02% |
| 52 | Blue Shield Insurance Company LTD | 1990 | 0.03% | |
| 53 | Pioneer Holdings (AFRICA) LIMITED | 1990 | 0.05% | |
| 54 | Apollo Investments Company Limited | 1990 | 0.05% | |
| 55 | United Insurance Company LTD | 1990 | 0.07% | |
| 56 | Kenya Reinsurance Corporation | 1990 | 0.22% | |
| 57 | First Reinsurance Brokers Limited | 2011 | 0.02% | |
| 58 | Libya | Libya Insurance Company (LIC) | 1990 | 3.79% |
| 59 | Madagascar | Compagnie Malgache d’Assurances et de Réassurances (NY HAVANA) | 1990 | 0.32% |
| 60 | Assurances Reassurances Omnibranches (ARO) | 1990 | 0.52% | |
| 61 | Mali | Compagnie d’Assurances Lafia | NA | 0.08% |
| 62 | Compagnie d’Assurance et de Réassurance (SABU-NYUMAN) | NA | 0.01% | |
| 63 | Mauritania | Nationale d’Assurance et de Réassurance (NASR) | 1990 | 0.15% |
| 64 | Mauritius | Rainbow Insurance Company LTD | NA | 0.01% |
| 65 | Anglo – Mauritius Assurance Society LTD | 1990 | 0.02% | |
| 66 | British American Insurance (Mauritius) LTD | 1990 | 0.02% | |
| 67 | Indian Ocean General Assurance LTD (IOGA) | 1990 | 0.02% | |
| 68 | Island Life Assurance Company LTD | 1990 | 0.02% | |
| 69 | Mauritian Eagle Insurance CO. LTD | 1990 | 0.03% | |
| 70 | State Insurance Corporation (SICOM) | 1990 | 0.02% | |
| 71 | Sun Insurance Company LTD | 1990 | 0.02% | |
| 72 | Swan Insurance Company LTD | 1990 | 0.02% | |
| 73 | Mauritius Union Assurance Company LTD | 1990 | 0.10% | |
| 74 | Sugar Insurance Fund Board | 1990 | 0.06% | |
| 75 | Morocco | Compagnie d’Assurances et de Réassurances ATLANTA | 1990 | 0.14% |
| 76 | SAHAM Assurance | 1990 | 0.16% | |
| 77 | Zurich Assurances Maroc | 1990 | 0.06% | |
| 78 | Compagnie d’Assurance Sanad | 1990 | 0.14% | |
| 79 | Axa Assurance Maroc | 1990 | 0.16% | |
| 80 | RMA Watanya | 1990 | 0.91% | |
| 81 | Société Centrale de Réassurance (SCR) | 1990 | 2.57% | |
| 82 | Mutuelle Agricole Marocaine d’Assurances (MAMDA) | NA | 0.44% | |
| 83 | Wafa Assurance | 1990 | 0.18% | |
| 84 | Niger | Société Nationale d’Assurance et de Réassurance (SNAR-LEYMA) | 1990 | 0.04% |
| 85 | Compagnie d’Assurances et de Réassurances du Niger (CAREN) | 1990 | 0.03% | |
| 86 | Nigeria | Royal Exchange Assurance (NIG) PLC | 1990 | 0.06% |
| 87 | Continental Reinsurance PLC | 1990 | 0.02% | |
| 88 | Leadway Assurance CO. LTD | 1990 | 0.47% | |
| 89 | Guinea Insurance Company LTD | 1990 | 0.02% | |
| 90 | Intercontinental West African Provencial Insurance Company LTD | 1990 | 0.02% | |
| 91 | United Nigeria Insurance CO. PLC (UNIC) | 1990 | 0.04% | |
| 92 | AIICO Insurance PLC | 1990 | 0.17% | |
| 93 | Nigerian Reinsurance Corporation | 1990 | 0.26% | |
| 94 | Nicon Insurance Corporation | 1990 | 0.44% | |
| 95 | Niger Insurance PLC | NA | 0.09% | |
| 96 | Custodian and Allied Insurance | 2013 | 0.09% | |
| 97 | Rwanda | Société Nouvelle d’Assurance du Rwanda (SONARWA) | 1990 | 0.18% |
| 98 | Senegal | La Prévoyance Assurances | 1990 | 0.07% |
| 99 | Allianz Sénégal | 1990 | 0.19% | |
| 100 | Société Sénégalaise de Réassurance (SEN RE) | 1990 | 0.12% | |
| 101 | Axa Sénégal | 2013 | 0.03% | |
| 102 | Sierra Leone | National Insurance Corporation of Sierra Leone (NIC (S/L) | 1990 | 0.03% |
| 103 | Sudan | Middle East Insurance Company | 2012 | 0.02% |
| 104 | Tanzania | National Insurance Corp. of Tanzania (NIC) | 1990 | 0.36% |
| 105 | Tanzania National Reinsurance Corporation (TAN RE) | 2011 | 0.27% | |
| 106 | Togo | Groupement Togolais d'Assurances/Compagnie / Africaine d’Assurances IARD (GTA/C2A IARD) | 1990 | 0.07% |
| 107 | Groupement Togolais d'Assurances/Compagnie / Africaine d’Assurances Vie (GTA/C2A VIE) | 1990 | 0.07% | |
| 108 | Tunisia | Groupement des Assurances de Tunisie (GAT) | NA | 0.26% |
| 109 | Société Tunisienne de Réassurance (TUNIS RE) | NA | 1.02% | |
| 110 | Uganda | Lion Assurance Company LIMITED | 1990 | 0.04% |
| 111 | National Insurance Corporation of Uganda (NIC) | 1990 | 0.14% | |
Total | 32.85% | |||
Africa Re: Shareholding per country
State % | Companies % | Total countries % | |
|---|---|---|---|
| Algeria | 1.33% | 6.84% | 8.17% |
| Angola | 0.59% | 1.02% | 1.61% |
| Benin | 0.42% | 0.30% | 0.73% |
| Burkina Faso | 0.40% | 0.37% | 0.78% |
| Burundi | 0.23% | 0.31% | 0.54% |
| Cameroon | 1.10% | 1.21% | 2.31% |
| Central African Republic | 0.24% | NA | 0.24% |
| Chad | 0.40% | 0.06% | 0.46% |
| Congo | 0.30% | 0.18% | 0.48% |
| DR of Congo | 0.63% | 0.05% | 0.68% |
| Côte d’Ivoire | 0.56% | 1.10% | 1.66% |
| Egypt | 4.04% | 4.36% | 8.41% |
| Eritrea | 0.23% | 0.39% | 0.62% |
| Ethiopia | 0.94% | 0.80% | 1.74% |
| Gabon | 0.44% | 0.20% | 0.64% |
| Gambia | 0.63% | NA | 0.63% |
| Ghana | 1.04% | 0.46% | 1.50% |
| Guinea | 0.55% | 0.12% | 0.67% |
| Guinea Bissau | 0.23% | NA | 0.23% |
| Kenya | 0.88% | 0.46% | 1.33% |
| Libya | 0.24% | NA | 0.24% |
| Liberia | 1.33% | 3.79% | 5.12% |
| Madagascar | 0.61% | 0.84% | 1.45% |
| Mali | 0.32% | 0.09% | 0.41% |
| Mauritania | 0.44% | 0.15% | 0.59% |
| Mauritius | 0.31% | 0.35% | 0.66% |
| Morocco | 3.12% | 4.78% | 7.89% |
| Niger | 0.23% | 0.07% | 0.30% |
| Nigeria | 6.33% | 1.68% | 8.01% |
| Rwanda | 0.23% | 0.18% | 0.42% |
| Senegal | 0.55% | 0.42% | 0.97% |
| Seychelles | 0.23% | NA | 0.23% |
| Sierra Leone | 0.30% | 0.03% | 0.33% |
| Somalia | 0.27% | NA | 0.27% |
| Sudan | 0.88% | 0.02% | 0.90% |
| Swaziland | 0.25% | NA | 0.25% |
| Tanzania | 0.54% | 0.63% | 1.18% |
| Togo | 0.25% | 0.14% | 0.38% |
| Tunisia | 0.56% | 1.28% | 1.84% |
| Uganda | 0.60% | 0.18% | 0.78% |
| Zambia | 0.76% | NA | 0.76% |
| Total | 33.59% | 32.85% | 66.44% |
Appendix III |
|---|
Africa Re: Gross written premiums per region (2000-2014)
Figures in millions USD
International business | North East Africa | Indian Ocean Islands | French speaking West and Central Africa | Austral Africa | Maghreb | East Africa | English speaking West Africa | Total | |||||||||
|---|---|---|---|---|---|---|---|---|---|---|---|---|---|---|---|---|---|
Premiums | % | Premiums | % | Premiums | % | Premiums | % | Premiums | % | Premiums | % | Premiums | % | Premiums | % | ||
| 2000 | 3.12 | 4% | NA | NA | NA | NA | 9.36 | 12% | 10.92 | 14% | 23.4 | 30% | 21.06 | 27% | 10.14 | 13% | 78 |
| 2001 | 4.25 | 5% | 5.95 | 7% | 5.95 | 7% | 10.2 | 12% | 11.9 | 14% | 17.85 | 21% | 16.15 | 19% | 12.75 | 15% | 85 |
| 2002 | 6.35 | 5% | 8.89 | 7% | 7.62 | 6% | 13.97 | 11% | 29.21 | 23% | 24.13 | 19% | 20.32 | 16% | 16.51 | 13% | 127 |
| 2003 | 9.9 | 5% | 9.9 | 5% | 13.86 | 7% | 19.8 | 10% | 61.38 | 31% | 35.64 | 18% | 25.74 | 13% | 21.78 | 11% | 198 |
| 2004 | 11.12 | 4% | 11.12 | 4% | 13.9 | 5% | 22.24 | 8% | 136.22 | 49% | 36.14 | 13% | 25.02 | 9% | 22.24 | 8% | 278 |
| 2005 | 12.8 | 5% | 10.24 | 4% | 12.8 | 5% | 20.48 | 8% | 125.44 | 49% | 25.6 | 10% | 25.6 | 10% | 23.04 | 9% | 256 |
| 2006 | 17.58 | 6% | 11.72 | 4% | 11.72 | 4% | 23.44 | 8% | 117.2 | 40% | 35.16 | 12% | 38.09 | 13% | 38.09 | 13% | 293 |
| 2007 | 22.2 | 6% | 14.8 | 4% | 7.4 | 2% | 25.9 | 7% | 162.8 | 44% | 44.4 | 12% | 44.4 | 12% | 48.1 | 13% | 370 |
| 2008 | 52.13 | 13% | 32.08 | 8% | 8.02 | 2% | 28.07 | 7% | 128.32 | 32% | 48.12 | 12% | 52.13 | 13% | 52.13 | 13% | 401 |
| 2009 | 53.6 | 10% | 37.52 | 7% | 10.72 | 2% | 32.16 | 6% | 209.04 | 39% | 53.6 | 10% | 64.32 | 12% | 75.04 | 14% | 536 |
| 2010 | 56.52 | 9% | 43.96 | 7% | 12.56 | 2% | 31.4 | 5% | 263.76 | 42% | 56.52 | 9% | 75.36 | 12% | 87.92 | 14% | 628 |
| 2011 | 44.17 | 7% | 56.79 | 9% | 12.62 | 2% | 44.17 | 7% | 233.47 | 37% | 50.48 | 8% | 94.65 | 15% | 94.65 | 15% | 631 |
| 2012 | 38.88 | 6% | 64.8 | 10% | 12.96 | 2% | 38.88 | 6% | 213.84 | 33% | 58.32 | 9% | 116.64 | 18% | 103.68 | 16% | 648 |
| 2013 | 20.1 | 3% | 67 | 10% | 13.4 | 2% | 60.3 | 9% | 194.3 | 29% | 60.3 | 9% | 140.7 | 21% | 113.9 | 17% | 670 |
| 2014 | 21.54 | 3% | 78.98 | 11% | 14.36 | 2% | 64.62 | 9% | 208.22 | 29% | 64.62 | 9% | 157.96 | 22% | 107.7 | 15% | 718 |
| Total(1) | 374.26 | 6.33% | 453.75 | 7.67% | 157.89 | 2.67% | 444.99 | 7.52% | 2106.02 | 35.59% | 634.28 | 10.72% | 918.14 | 15.52% | 827.67 | 13.98% | 5917 |
(1) Total of collected premiums from 2000 to 2014 Source: Atlas Magazine - Africa Re
Appendix IV |
|---|
Africa Re: Gross written premiums per class of business (2000-2014)
Figures in millions USD
Fire & Accident | Oil & Energy | Marine & Aviation | Life | Total | |||||
|---|---|---|---|---|---|---|---|---|---|
WP | % | WP | % | WP | % | WP | % | ||
| 2000 | 60.52 | 77.59% | ND | ND | 13.87 | 17.78% | 3.61 | 4.63% | 78 |
| 2001 | 64.10 | 75.41% | ND | ND | 17.18 | 20.21% | 3.72 | 4.38% | 85 |
| 2002 | 88.56 | 69.73% | 16.7 | 13.15% | 15.14 | 11.92% | 6.60 | 5.2% | 127 |
| 2003 | 140.14 | 70.78% | 22.8 | 11.51% | 25.40 | 12.83% | 9.66 | 4.88% | 198 |
| 2004 | 223.96 | 80.56% | 15.9 | 5.71% | 28.11 | 10.11% | 10.06 | 3.62% | 278 |
| 2005 | 190.11 | 74.26% | 31.2 | 12.2% | 26.24 | 10.25% | 8.42 | 3.29% | 256 |
| 2006 | 216.76 | 73.98% | 32.5 | 11.1% | 33.14 | 11.31% | 10.58 | 3.61% | 293 |
| 2007 | 287.71 | 77.76% | 35.0 | 9.46% | 37.56 | 10.15% | 9.73 | 2.63% | 370 |
| 2008 | 289.20 | 72.12% | 37.9 | 9.44% | 61.91 | 15.44% | 12.03 | 3% | 401 |
| 2009 | 401.46 | 74.90% | 48.8 | 9.1% | 67.00 | 12.50% | 18.76 | 3.5% | 536 |
| 2010 | 484.75 | 77.19% | 58.4 | 9.3% | 64.18 | 10.22% | 20.66 | 3.29% | 628 |
| 2011 | 458.36 | 72.64% | 84.6 | 13.41% | 62.41 | 9.89% | 25.62 | 4.06% | 631 |
| 2012 | 472.59 | 72.93% | 78.0 | 12.03% | 67.20 | 10.37% | 30.26 | 4.67% | 648 |
| 2013 | 464.11 | 69.27% | 113.8 | 16.99% | 56.88 | 8.49% | 35.18 | 5.25% | 670 |
| 2014 | 508.42 | 70.81% | 113.5 | 15.81% | 56.72 | 7.90% | 39.35 | 5.48% | 718 |
| Total(1) | 4350.74 | 73.6% | 689.1 | 11.6% | 632.93 | 10.7% | 244.25 | 4.1% | 5917 |
WP: Written premiums
(1) As from 2007, this class of business has been split into two categories: fire -engineering and accident-motor
(2) Total of collected premiums from 2000 to 2014 Source: Atlas Magazine - Africa Re
Appendix V |
|---|
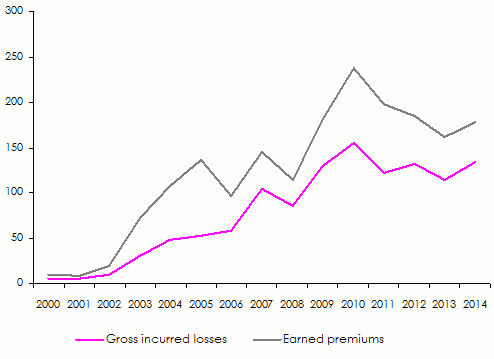
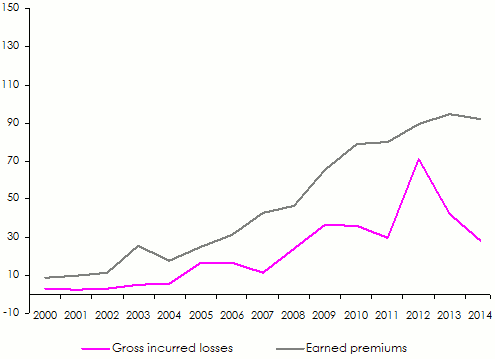
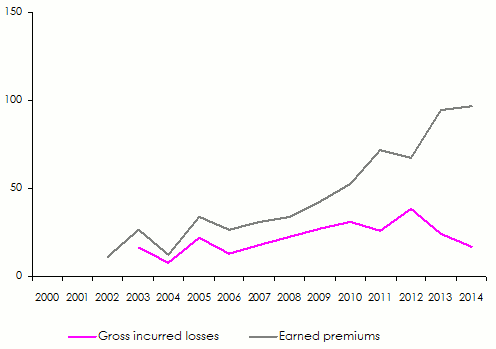
Africa Re: Loss ratios per region (2000-2014)
Figures in millions USD
2000 | 2001 | 2002 | 2003 | 2004 | 2005 | 2006 | 2007 | 2008 | 2009 | 2010 | 2011 | 2012 | 2013 | 2014 | ||
|---|---|---|---|---|---|---|---|---|---|---|---|---|---|---|---|---|
| Austral Africa | Gross earned premiums | 9.38 | 9.24 | 20.24 | 72.23 | 107.31 | 136.71 | 96.8 | 145.2 | 114.56 | 181.74 | 236.88 | 197.58 | 184.8 | 161.24 | 178.06 |
| Gross incurred losses | 5.62 | 5.26 | 10.05 | 30.28 | 48.63 | 52.73 | 58.58 | 104.11 | 85.19 | 129.20 | 154.78 | 122.14 | 132.34 | 114.24 | 133.94 | |
| Loss ratios | 59.94% | 56.91% | 49.64% | 41.92% | 45.32% | 38.57% | 60.52% | 71.7% | 74.36% | 71.09% | 65.34% | 61.82% | 71.61% | 70.85% | 75.22% | |
| English speaking West Africa | Gross earned premiums | 8.71 | 9.9 | 11.44 | 25.63 | 17.52 | 25.11 | 31.46 | 42.9 | 46.54 | 65.24 | 78.96 | 80.1 | 89.6 | 94.52 | 92.1 |
| Gross incurred losses | 3.31 | 2.80 | 3.14 | 5.22 | 5.79 | 16.56 | 16.89 | 11.50 | 23.76 | 36.61 | 36.14 | 29.82 | 70.94 | 42.19 | 28.14 | |
| Loss ratios | 37.95% | 28.25% | 27.41% | 20.38% | 33.02% | 65.95% | 53.68% | 26.81% | 51.06% | 56.12% | 45.77% | 37.23% | 79.17% | 44.64% | 30.55% | |
| East Africa | Gross earned premiums | 18.09 | 12.54 | 14.08 | 30.29 | 19.71 | 27.9 | 31.46 | 39.6 | 46.54 | 55.92 | 67.68 | 80.1 | 100.8 | 116.76 | 135.08 |
| Gross incurred losses | 10.84 | 7.14 | 6.65 | 13.17 | 9.23 | 11.14 | 14.44 | 18.60 | 21.70 | 22.94 | 33.39 | 33.88 | 43.74 | 62.63 | 62.19 | |
| Loss ratios | 59.94% | 56.91% | 47.24% | 43.49% | 46.81% | 39.92% | 45.9% | 46.98% | 46.62% | 41.03% | 49.34% | 42.3% | 43.39% | 53.64% | 46.04% | |
| Maghreb | Gross earned premiums | 20.1 | 13.86 | 16.72 | 41.94 | 28.47 | 27.9 | 29.04 | 39.6 | 42.96 | 46.6 | 50.76 | 42.72 | 50.4 | 50.04 | 55.26 |
| Gross incurred losses | 9.32 | 7.31 | 6.09 | 20.65 | 11.60 | 20.70 | 13.28 | 15.77 | 21.89 | 26.80 | 23.72 | 18.63 | 27.40 | 22.00 | 21.81 | |
| Loss ratios | 46.37% | 52.76% | 36.43% | 49.24% | 40.74% | 74.21% | 45.74% | 39.82% | 50.96% | 57.51% | 46.73% | 43.62% | 54.37% | 43.97% | 39.46% | |
| Nort East Africa | Gross earned premiums | NA | 4.62 | 6.16 | 11.65 | 8.76 | 11.16 | 9.68 | 13.2 | 28.64 | 32.62 | 39.48 | 48.06 | 56 | 55.6 | 67.54 |
| Gross incurred losses | NA | 2.44 | 1.69 | 5.63 | 3.24 | 7.01 | 6.10 | 7.43 | 22.47 | 20.51 | 24.06 | 31.72 | 31.43 | 23.62 | 36.49 | |
| Loss ratios | 46.37% | 52.76% | 27.44% | 48.34% | 36.94% | 62.83% | 63.02% | 56.28% | 78.46% | 62.89% | 60.93% | 66% | 56.12% | 42.48% | 54.03% | |
| French speaking West and Central Africa | Gross earned premiums | 8.04 | 7.92 | 9.68 | 23.3 | 17.52 | 22.32 | 19.36 | 23.1 | 25.06 | 27.96 | 28.2 | 37.38 | 33.6 | 50.04 | 55.26 |
| Gross incurred losses | 3.03 | 3.30 | 2.39 | 7.53 | 4.47 | 12.13 | 12.22 | 9.20 | 11.52 | 16.42 | 14.60 | 10.97 | 6.76 | 9.97 | 10.86 | |
| Loss ratios | 37.71% | 41.69% | 24.64% | 32.32% | 25.51% | 54.33% | 63.1% | 39.82% | 45.97% | 58.71% | 51.76% | 29.36% | 20.11% | 19.92% | 19.65% | |
| African islands of the Indian Ocean | Gross earned premiums | NA | 4.62 | 5.28 | 16.31 | 10.95 | 13.95 | 9.68 | 6.6 | 7.16 | 9.32 | 11.28 | 10.68 | 11.2 | 11.12 | 12.28 |
| Gross incurred losses | NA | NA | 2.53 | 8.52 | 7.30 | 6.58 | 2.06 | 4.03 | 2.80 | 6.30 | 5.17 | 7.98 | 1.82 | 6.77 | 4.55 | |
| Loss ratios | NA | NA | 47.88% | 52.26% | 66.71% | 47.2% | 21.26% | 61.08% | 39.08% | 67.63% | 45.82% | 74.73% | 16.28% | 60.89% | 37.04% | |
| International business | Gross earned premiums | 2.68 | 3.3 | 4.4 | 11.65 | 8.76 | 13.95 | 14.52 | 19.8 | 46.54 | 46.6 | 50.76 | 37.38 | 33.6 | 16.68 | 18.42 |
| Gross incurred losses | NA | NA | NA | NA | 2.90 | 4.95 | 9.87 | 22.67 | 33.25 | 31.60 | 35.72 | 30.20 | 22.02 | 11.16 | 15.18 | |
| Loss ratios | NA | NA | NA | NA | 33.13% | 35.45% | 67.98% | 114.49% | 71.45% | 67.81% | 70.38% | 80.78% | 65.55% | 66.9% | 82.4% |
Source: Atlas Magazine - Africa Re
 East Africa
 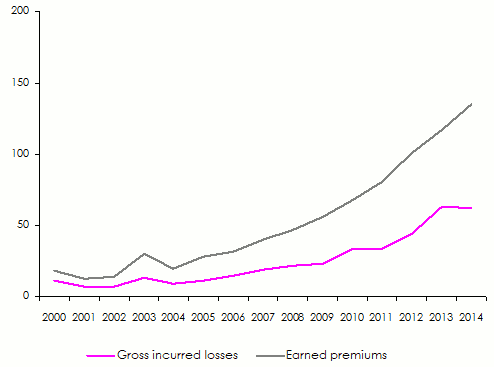 Maghreb
 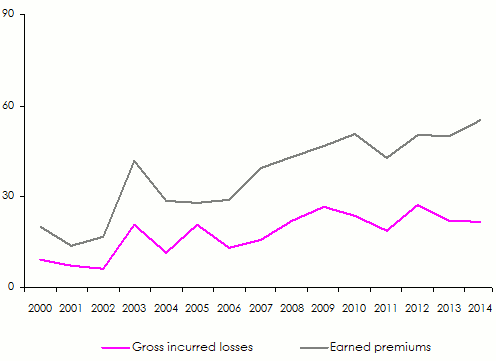 North East Africa
 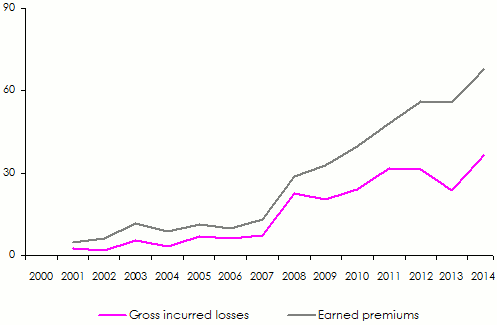 African islands of the Indian Ocean
 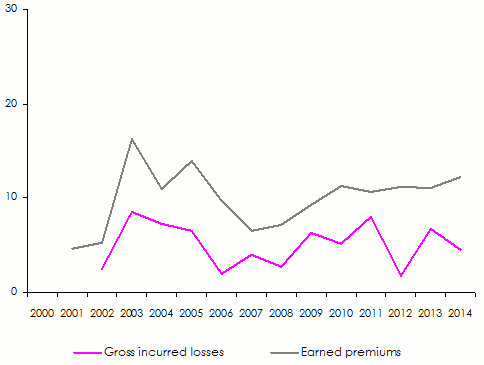 International business
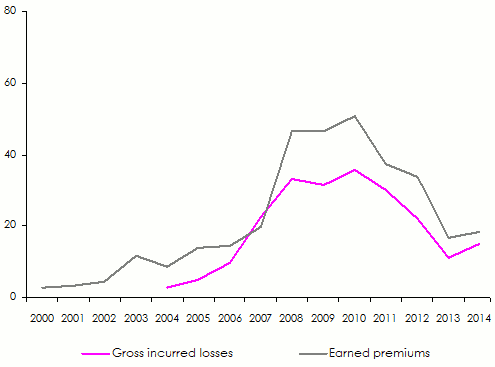
Appendix VI |
|---|
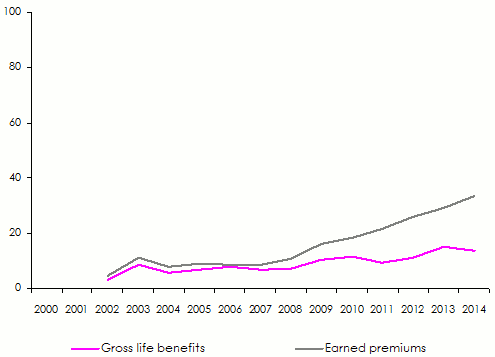
Africa Re: Loss ratios per non life insurance: 2000-2014)
Figures in millions USD
Fire & Accident | Oil & Energy | Marine & Aviation | |||||||
|---|---|---|---|---|---|---|---|---|---|
Gross earned premiums | Loss incurred losses | Loss ratios | Gross earned premiums | Loss incurred losses | Loss ratios | Gross earned premiums | Loss incurred losses | Loss ratios | |
| 2000 | 51.99 | 29.97 | 57.65% | NA | NA | NA | NA | NA | NA |
| 2001 | 49.77 | 23.13 | 46.48% | NA | NA | NA | 14.27 | 8.97 | 62.86% |
| 2002 | 61.36 | 31.39 | 51.15% | NA | NA | NA | 10.49 | 5.79 | 55.2% |
| 2003 | 164.92 | 99.66 | 60.43% | 26.82 | 16.21 | 60.43% | 29.89 | 11.39 | 38.09% |
| 2004 | 176.43 | 109.84 | 62.26% | 12.50 | 7.79 | 62.26% | 22.14 | 9.92 | 44.8% |
| 2005 | 207.19 | 135.31 | 65.31% | 34.04 | 22.23 | 65.31% | 28.60 | 15.12 | 52.88% |
| 2006 | 179.03 | 85.60 | 47.81% | 26.86 | 12.84 | 47.81% | 27.37 | 23.46 | 85.73% |
| 2007 | 256.61 | 148.35 | 57.81% | 31.22 | 18.04 | 57.775% | 33.50 | 21.39 | 63.865% |
| 2008 | 258.19 | 174.90 | 67.74% | 33.80 | 22.89 | 67.74% | 55.28 | 23.22 | 42% |
| 2009 | 349.03 | 222.16 | 63.65% | 42.41 | 26.99 | 63.65% | 58.25 | 26.68 | 45.8% |
| 2010 | 435.35 | 259.30 | 59.56% | 52.45 | 31.24 | 59.56% | 57.64 | 28.59 | 49.6% |
| 2011 | 387.90 | 230.95 | 59.54% | 71.61 | 25.79 | 36.01% | 52.81 | 22.61 | 42.81% |
| 2012 | 408.41 | 253.50 | 62.07% | 67.37 | 38.21 | 56.72% | 58.07 | 26.98 | 46.46% |
| 2013 | 385.14 | 235.59 | 61.17% | 94.46 | 24.09 | 25.5% | 47.20 | 18.61 | 39.42% |
| 2014 | 434.77 | 259.21 | 59.62% | 97.07 | 16.90 | 17.41% | 48.51 | 17.09 | 35.24% |
| Total | 3806.08 | 2298.85 | 60.40% | 590.61 | 263.21 | 44.57% | 544.02 | 259.82 | 47.76% |
Source: Atlas Magazine - Africa Re 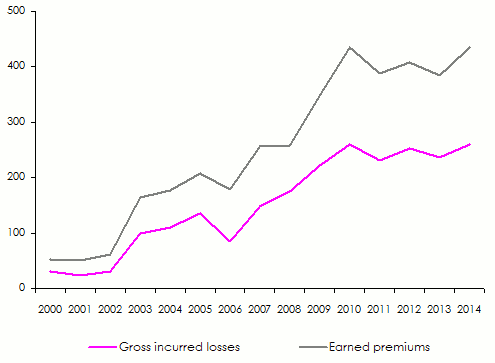

Appendix VII |
|---|
Africa Re: Evolution of management expenses, loss ratio and combined ratios: 2000-2014
| Year | Management expenses | Overhead expenses/Gross written premiums in % | Acquisition costs | Acquisition costs/Gross written premiums in % | Management expenses ratios(1) | Gross loss ratios(2) | Combined ratios(3) |
| 2000 | 4 520 366 | 5.80 | 24 800 000 | 31.79 | 37.59 | 46.82 | 84.41 |
| 2001 | 4 945 005 | 5.82 | 22 844 104 | 26.88 | 32.69 | 50.74 | 83.43 |
| 2002 | 5 411 478 | 4.26 | 29 192 144 | 22.99 | 27.25 | 52.91 | 80.16 |
| 2003 | 6 008 584 | 3.03 | 48 715 748 | 24.60 | 27.64 | 56.62 | 84.26 |
| 2004 | 7 532 773 | 2.71 | 67 633 968 | 24.33 | 27.04 | 60.33 | 87.37 |
| 2005 | 11 149 000 | 4.36 | 74 934 000 | 29.27 | 33.63 | 63.93 | 97.56 |
| 2006 | 12 840 000 | 4.38 | 75 604 000 | 25.80 | 30.19 | 55.90 | 86.09 |
| 2007 | 16 445 000 | 4.44 | 93 424 000 | 25.25 | 29.69 | 60.48 | 90.17 |
| 2008 | 17 392 000 | 4.34 | 103 841 000 | 25.90 | 30.23 | 62.25 | 92.48 |
| 2009 | 22 842 000 | 4.26 | 126 233 000 | 23.55 | 27.81 | 62.65 | 90.46 |
| 2010 | 27 094 000 | 4.31 | 161 682 000 | 25.75 | 30.06 | 58.12 | 88.18 |
| 2011 | 31 282 000 | 4.96 | 151 994 000 | 24.09 | 29.05 | 54.06 | 83.11 |
| 2012 | 30 910 000 | 4.77 | 157 069 000 | 24.24 | 29.01 | 59.10 | 88.11 |
| 2013 | 34 157 000 | 5.10 | 164 477 000 | 24.55 | 29.65 | 52.74 | 82.39 |
| 2014 | 37 780 000 | 5.26 | 180 910 000 | 25.20 | 30.46 | 49.46 | 79.92 |
(2) Calculated as follows: (Overhead expenses/Gross written premiums + Acquisition costs/Gross written premiums)
(3) Calculated as follows: Incurred losses (paid losses+outstanding losses)/Earned premiums of the year
(4) Calculated as follows: (1)+(2)