Côte d'Ivoire 2010
Breakdown of the 2009-2010 turnover per class of business
in USD| 2009 turnover | 2010 turnover | 2009/2010 evolution | 2010 shares | |
|---|---|---|---|---|
| Non life | ||||
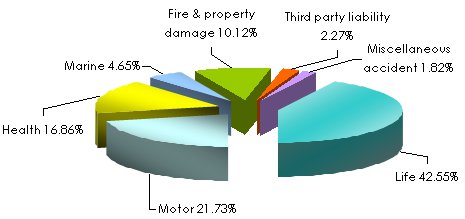
Health | 67 530 768 | 67 013 171 | -0.76% | 16.86% |
Motor | 85 087 097 | 86 400 124 | 1.54% | 21.73% |
Fire and property damage | 42 160 755 | 40 237 919 | -4.56% | 10.12% |
Third party liability | 8 331 647 | 9 012 010 | 8.16% | 2.27% |
Marine | 16 314 365 | 18 509 004 | 13.45% | 4.65% |
Miscellaneous accident | 5 632 388 | 7 231 155 | 28.38% | 1.82% |
Total non life | 225 057 020 | 228 403 383 | 1.48% | 57.45% |
| Life | ||||
Total life | 158 365 741 | 169 154 632 | 6.81% | 42.55% |
Grand total | 383 422 761 | 397 558 015 | 3.68% | 100% |
Breakdown of the 2010 turnover per class of business
Breakdown of the 2010 turnover per class of business and per non life company
in USD| Health | Motor | Property damage1 | TPL | Marine | Misc. accident | Total | 2010 shares | |
|---|---|---|---|---|---|---|---|---|
Colina SA | 14 849 377 | 11 567 747 | 15 351 250 | 1 764 452 | 7 302 102 | 582 903 | 51 417 831 | 22.51% |
Nsia CI | 10 837 249 | 9 077 649 | 5 274 707 | 1 940 947 | 2 310 506 | 700 528 | 30 141 586 | 13.20% |
Allianz | 4 298 344 | 6 157 788 | 6 192 572 | 1 677 102 | 2 887 861 | 2 035 132 | 23 248 799 | 10.18% |
Lmai | 6 212 852 | 5 631 563 | 5 506 017 | 994 255 | 684 576 | - | 19 029 263 | 8.33% |
Axa | 5 180 557 | 4 797 649 | 2 242 709 | 762 549 | 2 198 164 | - | 15 181 628 | 6.65% |
Loyale | 5 365 171 | 5 675 439 | 2 379 424 | 670 608 | 321 474 | 1 055 230 | 15 467 346 | 6.77% |
GNA - CI | 4 555 309 | 5 133 994 | 771 208 | 280 839 | 288 422 | 1 410 441 | 12 440 213 | 5.45% |
Atlantique | 3 852 108 | 5 116 308 | 802 334 | 211 169 | 1 816 757 | 11 798 676 | 5.16% | |
Sidam | 6 044 395 | 3 273 145 | 230 094 | 186 539 | 133 219 | 191 153 | 10 058 545 | 4.40% |
Matca | - | 6 797 760 | - | - | - | - | 6 797 760 | 2.98% |
CEA | 290 964 | 5 417 046 | 183 599 | 61 004 | 121 012 | - | 6 073 625 | 2.66% |
Safa | 853 423 | 3 602 508 | 104 210 | 69 872 | 28 511 | - | 4 658 524 | 2.04% |
Atlas | 218 893 | 3 754 763 | 21 136 | 44 387 | 12 923 | 245 746 | 4 297 848 | 1.88% |
Sonar CI | 2 754 078 | 1 218 258 | 433 125 | 61 373 | 12 850 | - | 4 479 684 | 1.96% |
Amsa | 311 883 | 3 220 910 | 486 622 | 114 847 | 86 547 | 4 220 809 | 1.85% | |
AAA | 508 805 | 2 489 550 | 63 745 | 42 104 | 232 817 | - | 3 337 021 | 1.46% |
Serenity | 132 565 | 1 827 986 | 184 275 | 83 978 | 31 255 | 854 596 | 3 114 655 | 1.36% |
Fedas CI | 747 198 | 1 640 061 | 10 892 | 45 985 | 40 008 | 155 426 | 2 639 570 | 1.16% |
Total | 67 013 171 | 86 400 124 | 40 237 919 | 9 012 010 | 18 509 004 | 7 231 155 | 228 403 383 | 100% |
Breakdown of the 2010 turnover per class of business and per life company
in USD| Individual insurance | Group insurance | Total | 2010 shares | |
|---|---|---|---|---|
Colina Vie | 25 322 222 | 7 780 448 | 33 102 670 | 19.57% |
UA Vie | 9 834 865 | 22 552 701 | 32 387 566 | 19.15% |
Allianz Vie | 14 062 439 | 11 446 959 | 25 509 398 | 15.08% |
Nsia Vie | 21 281 331 | 7 625 071 | 28 906 402 | 17.09% |
Lmai Vie | 17 021 177 | 615 182 | 17 636 359 | 10.43% |
Loyale Vie | 7 682 039 | 3 671 049 | 11 353 088 | 6.71% |
Soma Vie | 811 389 | 5 251 210 | 6 062 599 | 3.58% |
Beneficial Life | 8 082 532 | - | 8 082 532 | 4.78% |
Stam Vie | 3 138 391 | 592 117 | 3 730 508 | 2.21% |
AAA Vie | 2 279 221 | 6 366 | 2 285 587 | 1.35% |
Cea Vie | 97 923 | - | 97 923 | 0.05% |
Total | 109 613 529 | 59 541 103 | 169 154 632 | 100% |
Exchange rate FCFA/USD as at 31/12 | 2009 | 2010 |
0.002229 | 0.002062 |
