FANAF 2008

The FANAF zone in 2008 : countries' turnover
in thousands USD| Rank | Country | Turnover | 2007/08 evolution | Market shares |
|---|---|---|---|---|
| 1 | Côte d'Ivoire | 368 104 | 12.6% | 26.9% |
| 2 | Cameroon | 241 359 | 2.6% | 17.7% |
| 3 | Senegal | 172 697 | 10.6% | 12.6% |
| 4 | Gabon | 149 105 | 6.9% | 10.9% |
| 5 | Benin | 64 692 | 17.1% | 4.7% |
| 6 | Congo Brazzaville | 57 967 | 1.0% | 4.2% |
| 7 | Burkina Faso | 57 058 | 3.9% | 4.2% |
| 8 | Rwanda | 54 453 | 0.0% | 4.0% |
| 9 | Togo | 45 230 | 9.0% | 3.3% |
| 10 | Mali | 44 954 | 16.9% | 3.3% |
| 11 | Madagascar | 35 010 | 4.4% | 2.6% |
| 12 | Niger | 31 574 | 8.1% | 2.3% |
| 13 | Chad | 13 710 | -10.3% | 1.0% |
| 14 | Burundi | 12 817 | 11.7% | 0.9% |
| 15 | Guinea | 11 823 | -9.2% | 0.9% |
| 16 | Central Afr. Rep. | 6 157 | 17.9% | 0.5% |
Total | 1 366 711 | 7.8% * | 100% | |
The FANAF zone in 2008: top twenty companies
in thousands USD| Companies | Category | Country | 2008 written premiums | 2007/08 growth |
|---|---|---|---|---|
Omnium Gabonais d'Assurances et de Réassurances | NL | Gabon | 51 647 | 2.3% |
Colina SA | NL | Côte d'Ivoire | 51 160 | 12.8% |
Colina Vie Côte d'Ivoire | L | Côte d'Ivoire | 34 022 | 3.7% |
Nouvelle Société Interafricaine d'Assurances | NL | Côte d'Ivoire | 33 191 | 22.3% |
Chanas Assurances | NL | Cameroon | 31 822 | -17.0% |
Union des Assurances de Côte d'Ivoire Vie | L | Côte d'Ivoire | 31 009 | 26.2% |
Axa Assurances | NL | Cameroon | 26 866 | 10.1% |
Nouvelle Société Interafricaine d'Assurances | NL | Gabon | 26 790 | -10.2% |
Assurances et réassurances Omnibranches | NL | Madagascar | 26 346 | 3.2% |
Activa Assurances | NL | Cameroon | 22 688 | 3.7% |
AXA Assurances | NL | Senegal | 22 232 | -10.0% |
Allianz Cameroun Assurances | NL | Cameroon | 22 052 | 4.6% |
Allianz Cameroun Assurances Vie | L | Cameroon | 21 538 | 2.1% |
Saar Assurances | NL | Cameroon | 21 020 | -4.5% |
Axa Assurances | NL | Gabon | 20 131 | 8.1% |
Allianz Sénégal Assurances | NL | Senegal | 19 491 | 17.1% |
Allianz Côte d'Ivoire Assurances Vie | L | Côte d'Ivoire | 19 159 | 18.0% |
Nsia Vie Côte d'Ivoire | L | Côte d'Ivoire | 18 350 | 2.0% |
Le Millenium Assurances Internationales IARD | NL | Côte d'Ivoire | 18 041 | 4.8% |
Assurances Industrielles et Commerciales | NL | Gabon | 17 778 | 0.8% |
The FANAF zone in 2008: the insurance groups' results
in thousands USD| Colina | Allianz | Nsia | Sunu | Axa | Total | |
|---|---|---|---|---|---|---|
Number of companies | 10 | 13 | 8 | 15 | 4 | 50 |
Written premiums | 148 234 | 145 156 | 130 478 | 118 804 | 86 838 | 629 510 |
2007/2008 growth | 15.87% | 7.98% | 6.14% | -0.23% | -1.46% | 6.24% |
Net operating results | 13 812 | 15 112 | 5 665 | 9 951 | 7 506 | 52 045 |
Expenses/WP1 | 27% | 31% | 39% | 28% | 45% | 33% |
Productivity per employee | 308 | 357 | 363 | 350 | 243 | 3223 |
Loss ratio2 | 37% | 39% | 41% | 47% | 37% | 39% |
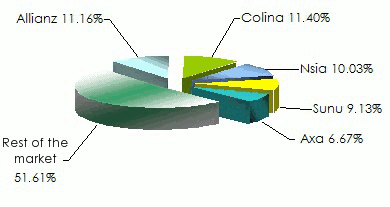
The insurance groups' market shares in 2008
 Exchange rate FCFA/USD as at 31/12/2008: 0.0022