Gulf Insurance Group - GIG
- Date de création: 9 April1962, Kuwait
- Classes of business: Life and non-life
- Rating:
- Standard & Poor’s : A- / Positive
- A.M. Best : A / Under review
- Moody's : A3 / Negative - Regional presence: 11 countries (Kuwait, Bahrain, Jordan, Egypt, Turkey, Algeria, Syria, Iraq, Lebanon, Saudi Arabia and the United Arab Emirates)
- Number of employees: 2 500
GIG in 2020
 |  |
Farqad Abdullah Al-Sane Chairman of the Board of Directors | Khaled Saoud Al Hasan Group CEO |
Share capital | 61 243 719 USD |
Turnover | 1 455 254 658 USD |
Assets | 2 621 824 920 USD |
Shareholder’s equity | 475 867 551 USD |
Net result | 65 794 393 USD |
Net non-life loss ratio | 69.95% |
Net non-life management expenses ratio | 26.38% |
Net non-life combined ratio | 96.33% |
Management
| Farqad Abdullah Al-Sane | Chairman of the Board of Directors |
| Khaled Saoud Al Hasan | Board member and Group CEO |
| Farid Joseph Saber | Assistant Group CEO -Operations |
| Osama Kamel Mostafa Aly Kishk | Group Chief Financial Officer |
| Sridharan Sundaresan | Group Technical Head - Reinsurance |
Shareholding (September 2021)
| Shareholders | Shares |
KIPCO Group | 46.32% |
Fairfax Financial Holdings Limited | 43.69% |
Others | 9.99% |
Read also | S&P upgrades GIG's rating
GIG: major technical highlights
Figures in thousands USD| Highlights | 2016 | 2017 | 2018 | 2019 | 2020 |
|---|---|---|---|---|---|
Gross written premiums | 695 711 | 1 006 586 | 1 195 740 | 1 296 388 | 1 455 255 |
- Gross non-life written premiums | 629 972 | 974 232 | 1 142 426 | 1 233 324 | 1 381 963 |
- Gross life written premiums | 65 739 | 32 354 | 53 315 | 63 064 | 73 292 |
Net written premiums | 339 744 | 444 395 | 561 300 | 600 973 | 630 275 |
Net non-life written premiums | 285 301 | 422 683 | 526 959 | 557 666 | 575 666 |
Net earned premiums | 343 948 | 416 014 | 541 245 | 596 438 | 612 416 |
Net non-life earned premiums | 290 285 | 397 470 | 502 456 | 556 372 | 577 176 |
Non-life incurred losses | 209 241 | 307 050 | 377 621 | 413 547 | 403 757 |
Non-life management expenses | 99 778 | 131 554 | 141 363 | 148 178 | 151 870 |
Net non-life loss ratio (1) | 72.08% | 77.25% | 75.16% | 74.33% | 69.95% |
Net non-life management expenses ratio (2) | 34.97% | 31.12% | 26.83% | 26.57% | 26.38% |
Net non-life combined ratio (3) | 107.05% | 108.37% | 101.99% | 100.90% | 96.33% |
Net result | 47 019 | 35 552 | 48 087 | 50 278 | 65 794 |
(1) Net non-life loss ratio = Non-life incurred losses / Net non-life earned premiums
(2) Net non-life management expenses ratio = Non-life management expenses / Net non-life reinsurance written premiums
(3) Net non-life combined ratio = Net non-life loss ratio + Net non-life management expenses ratio
Exchange rate as at 31/12/2020 : 1 KWD = 3.27438 USD ; 31/12/2019 : 1 KWD = 3.28983 USD ; at 31/12/2018 : KWD = 3.27956 USD ; at 31/12/2017 : 1 KWD = 3.30268 USD ; at 31/12/2016 : 1 KWD = 3.26307 USD.
GIG : turnover breakdown per class of business
Figures in thousands USD| Class of business | 2016 | 2017 | 2018 | 2019 | 2020 | 2020 shares |
|---|---|---|---|---|---|---|
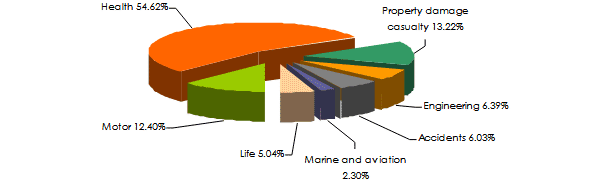
Health | 272 630 | 531 973 | 596 142 | 652 484 | 794 869 | 54.62% |
Property damage | 83 556 | 103 405 | 134 688 | 162 293 | 192 338 | 13.22% |
Motor | 149 691 | 167 908 | 191 048 | 198 496 | 180 474 | 12.40% |
Engineering | 57 653 | 74 055 | 107 342 | 98 310 | 92 949 | 6.39% |
Accident | 39 257 | 68 197 | 78 323 | 86 191 | 87 838 | 6.03% |
Marine and aviation | 27 186 | 28 695 | 34 882 | 35 551 | 33 493 | 2.30% |
| Total non-life | 629 972 | 974 232 | 1 142 426 | 1 233 324 | 1 381 963 | 94.96% |
| Life | 65 739 | 32 354 | 53 315 | 63 064 | 73 292 | 5.04% |
| Grand total | 695 711 | 1 006 586 | 1 195 740 | 1 296 388 | 1 455 255 | 100% |
Breakdown of 2020 turnover per class of business
GIG : net written premiums per class of business
Figures in thousands USD| 2016 | 2017 | 2018 | 2019 | 2020 | 2019-2020 evolution (1) | |
|---|---|---|---|---|---|---|
Health | 111 332 | 190 715 | 256 009 | 280 168 | 315 615 | 13.18% |
Property damage | 7 838 | 9 597 | 15 722 | 17 562 | 21 604 | 23.60% |
Motor | 139 985 | 157 511 | 180 732 | 187 781 | 169 032 | -9.56% |
Engineering | 7 435 | 28 735 | 31 510 | 27 088 | 28 195 | 4.58% |
Accident | 12 815 | 28 566 | 32 863 | 35 089 | 31 319 | -10.32% |
Marine and aviation | 5 895 | 7 559 | 10 123 | 9 979 | 9 900 | -0.32% |
| Total non-life | 285 301 | 422 683 | 526 959 | 557 666 | 575 666 | 3.71% |
| Life | 54 444 | 21 712 | 34 341 | 43 307 | 54 609 | 26.69% |
| Grand total | 339 744 | 444 395 | 561 300 | 600 973 | 630 275 | 5.37% |
GIG : net earned premiums per class of business
Figures in thousands USD| 2016 | 2017 | 2018 | 2019 | 2020 | 2019-2020 evolution (1) | |
|---|---|---|---|---|---|---|
Health | 116 890 | 196 307 | 249 887 | 285 231 | 316 720 | 11.56% |
Property damage | 8 158 | 7 596 | 10 523 | 19 044 | 19 828 | 4.61% |
Motor | 139 581 | 144 088 | 172 104 | 184 507 | 178 381 | -2.86% |
Engineering | 6 949 | 16 174 | 28 015 | 24 024 | 23 052 | -3.60% |
Accident | 12 787 | 26 331 | 32 011 | 33 568 | 29 396 | -12.02% |
Marine and aviation | 5 921 | 6 974 | 9 916 | 9 998 | 9 800 | -1.52% |
| Total non-life | 290 285 | 397 470 | 502 456 | 556 372 | 577 176 | 4.23% |
| Life | 53 663 | 18 545 | 38 789 | 40 065 | 35 240 | -11.63% |
| Grand total | 343 948 | 416 014 | 541 245 | 596 438 | 612 416 | 3.16% |
(1) Evolution in local currency
GIG : non-life incurred losses per class of business
Figures in thousands USD| 2016 | 2017 | 2018 | 2019 | 2020 | 2019-2020 evolution (1) | |
|---|---|---|---|---|---|---|
Health | 101 272 | 179 314 | 197 596 | 230 374 | 239 575 | 4.48% |
Property damage | 1 316 | 4 026 | 8 019 | 3 639 | 10 454 | 188.64% |
Motor | 102 208 | 110 793 | 142 799 | 151 427 | 126 410 | -16.13% |
Engineering | 341 | 5 072 | 17 963 | 14 951 | 14 544 | -2.26% |
Accident | 3 107 | 6 011 | 7 952 | 11 990 | 9 733 | -18.44% |
Marine and aviation | 997 | 1 833 | 3 292 | 1 166 | 3 041 | 162.01% |
| Total non-life | 209 241 | 307 050 | 377 621 | 413 547 | 403 757 | -1.91% |
GIG : non-life management expenses per class of bsuiness
Figures in thousands USD| 2016 | 2017 | 2018 | 2019 | 2020 | 2019-2020 evolution (1) | |
|---|---|---|---|---|---|---|
Health | 22 441 | 29 731 | 36 546 | 40 430 | 39 844 | -0.99% |
Property damage | 12 718 | 15 734 | 17 751 | 18 100 | 20 862 | 15.80% |
Motor | 41 897 | 43 198 | 45 724 | 48 432 | 45 797 | -4.99% |
Engineering | 8 268 | 13 406 | 11 000 | 12 069 | 11 354 | -5.48% |
Accident | 8 076 | 22 341 | 22 168 | 21 027 | 26 113 | 24.77% |
Marine and aviation | 6 378 | 7 143 | 8 173 | 8 119 | 7 900 | -2.24% |
| Total non-life | 99 778 | 131 554 | 141 363 | 148 178 | 151 870 | 2.98% |
(1) Evolution in local currency
GIG : net non-life loss ratio per class of business
| 2016 | 2017 | 2018 | 2019 | 2020 | |
|---|---|---|---|---|---|
Health | 86.64% | 91.34% | 79.07% | 80.77% | 75.64% |
Property damage | 16.13% | 53.00% | 76.20% | 19.11% | 52.72% |
Motor | 73.23% | 76.89% | 82.97% | 82.07% | 70.87% |
Engineering | 4.90% | 31.36% | 64.12% | 62.23% | 63.09% |
Accident | 24.30% | 22.83% | 24.84% | 35.72% | 33.11% |
Marine and aviation | 16.83% | 26.29% | 33.20% | 11.66% | 31.03% |
| Total non-life | 72.08% | 77.25% | 75.16% | 74.33% | 69.95% |
GIG : net non-life management expenses ratio
| 2016 | 2017 | 2018 | 2019 | 2020 | |
|---|---|---|---|---|---|
Health | 20.16% | 15.59% | 14.28% | 14.43% | 12.62% |
Property damage | 162.26% | 163.95% | 112.91% | 103.06% | 96.56% |
Motor | 29.93% | 27.43% | 25.30% | 25.79% | 27.09% |
Engineering | 111.20% | 46.66% | 34.91% | 44.56% | 40.27% |
Accident | 63.02% | 78.21% | 67.46% | 59.93% | 83.38% |
Marine and aviation | 108.20% | 94.50% | 80.74% | 81.36% | 79.80% |
| Total non-life | 34.97% | 31.12% | 26.83% | 26.57% | 26.38% |
GIG : net non-life combined ratios per class of business
| 2016 | 2017 | 2018 | 2019 | 2020 | |
|---|---|---|---|---|---|
Health | 106.80% | 106.93% | 93.35% | 95.20% | 88.26% |
Property damage | 178.39% | 216.95% | 189.11% | 122.17% | 149.28% |
Motor | 103.16% | 104.32% | 108.27% | 107.86% | 97.96% |
Engineering | 116.10% | 78.02% | 99.03% | 106.79% | 103.36% |
Accident | 87.32% | 101.04% | 92.30% | 95.65% | 116.49% |
Marine and aviation | 125.03% | 120.79% | 113.94% | 93.02% | 110.83% |
| Total non-life | 107.05% | 108.37% | 101.99% | 100.90% | 96.33% |

GIG : Contact
| Head Office | KIPCO Tower, Floor 40 Khaled Ibn Alwaleed Street, Sharq P.O. Box 1040, Safat 13011, Kuwait |
| Phone | +965 1802080 |
| Fax | +965 22961826 |
contacts [at] gig [dot] com [dot] kw | |
| Website |