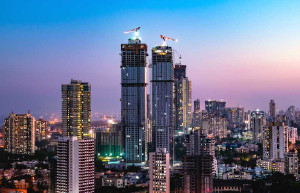
Indian insurance at regional and global level
 Globally, India ranks 11th in terms of total life and non-life premiums. The Indian insurance market country occupied the 17th position in the same ranking in 2006.
Over the period 2006 to 2018, India’s world market share almost doubled from 1.09% to almost 2%.
Indian insurance market: Evolution of the main insurance highlights (2019-2018)
| Highlights* | 2009 | 2010 | 2011 | 2012 | 2013 | 2014 | 2015 | 2016 | 2017 | 2018 |
|---|---|---|---|---|---|---|---|---|---|---|
Total premiums (in millions USD) | 66 645 | 73 627 | 65 270 | 64 082 | 65 439 | 65 839 | 69 869 | 84 232 | 93 676 | 97 368 |
Life premiums (in millions USD) | 58 956 | 64248 | 55118 | 52 558 | 52 488 | 52 332 | 55 335 | 64 487 | 70 519 | 73 018 |
Non-life premiums (in millions USD) | 7 689 | 9 379 | 10 152 | 11 524 | 12 951 | 13 507 | 14 534 | 19 745 | 23 157 | 24 350 |
Global insurance market share | 1.62% | 1.69% | 1.43% | 1.39% | 1.42% | 1.38% | 1.52% | 1.79% | 1.92% | 1.87% |
Insurance market density (in USD) | 54.70 | 59.65 | 52.22 | 50.62 | 51.08 | 50.80 | 53.33 | 63.57 | 69.96 | 71.97 |
Insurance penetration rate (%) | 4.71% | 4.38% | 3.90% | 3.52% | 3.49% | 3.31% | 3.36% | 3.55% | 3.56% | 3.56% |
Number of insurance companies | 44 | 48 | 49 | 52 | 52 | 53 | 54 | 62 | 68 | 70 |
* * Highlights as at 31 March. The fiscal year runs from 1 April of the year Y to 31 March of Y+1.
Source: IRDAI
Indian insurance market: Life and non-life premiums in 2018
In billion USD
| Life premiums | Non life premiums | Total | % of life premiums | Regional market shares | Global market shares | |
|---|---|---|---|---|---|---|
China | 313.365 | 261.512 | 574.877 | 54.51% | 34.22% | 11.07% |
Japan | 334.243 | 106.405 | 440.648 | 75.85% | 26.23% | 8.49% |
South Korea | 98.072 | 80.951 | 179.024 | 54.78% | 10.66% | 3.45% |
Taiwan | 102.044 | 19.864 | 121.908 | 83.71% | 7.26% | 2.35% |
India* | 73.018 | 24.350 | 97.368 | 74.99% | 5.80% | 1.87% |
Asia | 1 060.947 | 532.053 | 1 593 | 66.6% | - | 30.67% |
World | 2 820.175 | 2 373.050 | 5 193. 225 | 54.3% | - | - |
* Premiums as at 31 March 2019 for India and as at 31 December 2018 for the other countries, Asia and world
Source: Sigma and IRDAI
Read also | Indian insurance market structure
India-China: A comparative analysis of insurance markets
| Inde | Chine | |||||
|---|---|---|---|---|---|---|
| 2014 | 2018 | 2014/2018 evolution | 2014 | 2018 | 2014/2018 evolution | |
Population* | 1 296 000 000 | 1 353 000 000 | 4.40% | 1 364 000 000 | 1 393 000 000 | 2.13% |
GDP* (in million USD) | 2 039 000 | 2 719 000 | 33.35% | 10 439 000 | 13 608 000 | 30.36% |
GDP annual growth rate* | 7.44% | 6.81% | -8.10% | 7.30% | 6.57% | -10.00% |
Total premiums** (in million USD) | 65 840 | 97 368 | 47.89% | 328 440 | 574 877 | 75.03% |
Global insurance market share | 1.38% | 1.87% | 35.51% | 6.87% | 11.07% | 61.14% |
Insurance density (in USD) | 50.8 | 71.97 | 41.67% | 240.79 | 412.69 | 71.39% |
Insurance penetration rate (%) | 3.31% | 3.56% | 7.55% | 3.15% | 4.22% | 34.27% |
Number of insurance companies | 53 | 70 | 32.08% | 136 | 195 | 43.38% |
The year ends on 31 March of the year (Y+1) for India and on 31 décembre of the year (Y) for China
* Source: Wordl Bank ** Source: IRDAI for India
0
Your rating: None
Mon, 10/08/2020 - 13:19
The online magazine
Live coverage
04/24
04/24
04/24
04/24
04/23
Latest news
