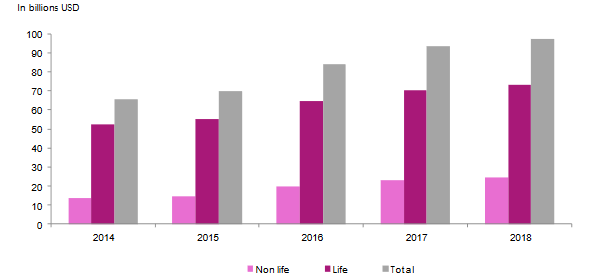
Indian insurance industry: Evolution of life and non-life premiums (2014-2018)
 India non-life insurance, boosted by foreign investment, jumped 80% over the same period. Premiums stood at 24.349 billion USD at 31 March 2019 compared to 13.507 billion USD at the end of the 2014-2015 fiscal year.
The non-life insurance market share has continued to increase over the past five years, from 20.52% to 25%.
In billions USD
| 2014 | 2015 | 2016 | 2017 | 2018 | 2017-2018 evolution | 2018 shares | |
|---|---|---|---|---|---|---|---|
Non-life premiums | 13.507 | 14.534 | 19.745 | 23.157 | 24.350 | 5.15% | 25.01% |
Life premiums | 52.332 | 55.335 | 64.487 | 70.519 | 73.018 | 3.54% | 74.99% |
Total life and non life | 65.839 | 69.869 | 84.232 | 93.676 | 97.368 | 3.94% | 100% |
Highlights as at 31 March. The fiscal year runs from 1 April of the year Y to 31 March of Y+1.
Read also:
Density and insurance penetration rate in India
Insurance density
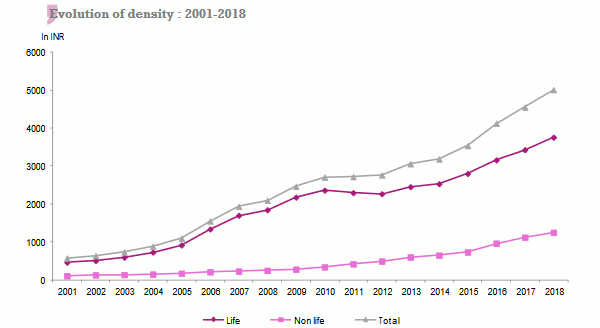
From 2001 to 2018, that is in 17 years, the density of insurance in India continued on an upward curve. It went from 576 INR (13.25 USD) in 2001 to 5 009 INR (71.97 USD) in 2018, life and non-life insurance combined.
After experiencing a period of rapid growth, the density of insurance stabilized from 2010 around 2 700 INR (52 USD) during the period 2010-2012. It is only from 2013 that this indicator will experience a new rebound.
In detail, the life activity is experiencing an evolution almost similar to that of the global industry in terms of insurance density. It went from 466 INR (10.72 USD) in 2001 to 3 756 INR (53.97 USD) in 2018.
Non-life insurance posted a density of 1 253 INR (18 USD) in 2018, compared to 110 INR (2.53 USD) in 2001. This important advance is due to the emergence of a middle class that uses financial products to protect itself.
Evolution of density: 2001-2018 *
| Life | Non-life | Total | ||||
|---|---|---|---|---|---|---|
| In INR | In USD | In INR | En USD | In INR | In USD | |
| 2018 | 3756 | 53.97 | 1253 | 18.00 | 5009 | 71.97 |
| 2017 | 3427 | 52.67 | 1125 | 17.29 | 4552 | 69.96 |
| 2016 | 3158 | 48.66 | 967 | 14.90 | 4125 | 63.56 |
| 2015 | 2801 | 42.24 | 736 | 11.10 | 3537 | 53.34 |
| 2014 | 2532 | 40.39 | 653 | 10.42 | 3185 | 50.81 |
| 2013 | 2454 | 40.98 | 605 | 10.10 | 3059 | 51.08 |
| 2012 | 2269 | 41.52 | 497 | 9.10 | 2766 | 50.62 |
| 2011 | 2297 | 44.10 | 423 | 8.12 | 2720 | 52.22 |
| 2010 | 2363 | 52.06 | 345 | 7.60 | 2708 | 59.66 |
| 2009 | 2179 | 48.40 | 284 | 6.30 | 2463 | 54.70 |
| 2008 | 1847 | 35.41 | 253 | 4.85 | 2100 | 40.26 |
| 2007 | 1702 | 42.65 | 235 | 5.89 | 1937 | 48.54 |
| 2006 | 1340 | 30.85 | 214 | 4.93 | 1554 | 35.78 |
| 2005 | 922 | 21.23 | 177 | 4.07 | 1099 | 25.30 |
| 2004 | 733 | 16.87 | 155 | 3.57 | 888 | 20.44 |
| 2003 | 599 | 13.79 | 140 | 3.22 | 739 | 17.01 |
| 2002 | 510 | 11.74 | 134 | 3.08 | 644 | 14.82 |
| 2001 | 466 | 10.73 | 110 | 2.53 | 576 | 13.26 |
* Highlights as at 31 March. The fiscal year runs from 1 April of the year Y to 31 March of Y+1.
Source: Atlas Magazine
Insurance penetration rate
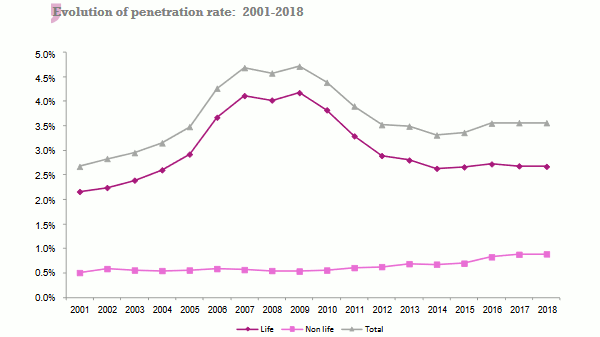
Like insurance density, the penetration rate has also been going up and down during the period studied. This indicator rose from 2.67% for all activity in 2001 to 3.56% in 2018, after posting a rate of 4.71% in 2009.
It is life insurance that draws the insurance business in India with higher rates than non-life. From 2.16% recorded in 2001, this rate reached 4.11% in 2007 and 4.17% in 2009 before falling to 2.67% in 2018.
In non-life insurance, the penetration rate increased by 75%, going from 0.51% in 2001 to 0.89% in 2018.
Read also | Indian insurance market structure
Evolution of penetration rate: 2001-2018 *
| Life | Non-life | Total | |
|---|---|---|---|
| 2018 | 2.67% | 0.89% | 3.56% |
| 2017 | 2.68% | 0.88% | 3.56% |
| 2016 | 2.72% | 0.83% | 3.55% |
| 2015 | 2.66% | 0.70% | 3.36% |
| 2014 | 2.63% | 0.68% | 3.31% |
| 2013 | 2.80% | 0.69% | 3.49% |
| 2012 | 2.89% | 0.63% | 3.52% |
| 2011 | 3.29% | 0.61% | 3.90% |
| 2010 | 3.82% | 0.56% | 4.38% |
| 2009 | 4.17% | 0.54% | 4.71% |
| 2008 | 4.02% | 0.55% | 4.57% |
| 2007 | 4.11% | 0.57% | 4.68% |
| 2006 | 3.67% | 0.59% | 4.26% |
| 2005 | 2.92% | 0.56% | 3.48% |
| 2004 | 2.60% | 0.55% | 3.15% |
| 2003 | 2.39% | 0.56% | 2.95% |
| 2002 | 2.24% | 0.59% | 2.83% |
| 2001 | 2.16% | 0.51% | 2.67% |
* Highlights as at 31 March. The fiscal year runs from 1 April of the year Y to 31 March of Y+1.
Source: Atlas Magazine
Read also | Indian insurance at regional and global level