Kenya 2013
Turnover per non life company 2012-2013
in thousands USD| 2012 | 2013 | 2013 shares | 2012-2013 evolution | |
|---|---|---|---|---|
Jubilee | 94 437 | 101 796 | 10% | 7.8% |
CIC General | 76 587 | 94 684 | 9.3% | 23.6% |
UAP Insurance | 69 213 | 90 311 | 8.9% | 30.5% |
APA Insurance | 65 292 | 77 009 | 7.6% | 17.9% |
ICEA Lion General | 46 892 | 53 621 | 5.3% | 14.4% |
Britam | 36 357 | 44 961 | 4.4% | 23.7% |
Heritage | 39 779 | 41 702 | 4.1% | 4.8% |
AIG Kenya | 37 415 | 41 180 | 4% | 10.1% |
First Assurance | 34 369 | 38 102 | 3.7% | 10.9% |
GA Insurance | 27 470 | 36 292 | 3.6% | 32.1% |
Kenindia | 39 438 | 32 613 | 3.2% | -17.3% |
AAR Insurance | - | 30 784 | 3% | - |
Real | 25 903 | 29 815 | 2.9% | 15.1% |
Directline | 23 965 | 26 142 | 2.6% | 9.1% |
Amaco | 22 337 | 25 811 | 2.5% | 15.6% |
Resolution | - | 24 038 | 2.4% | - |
Invesco | 17 991 | 21 006 | 2.1% | 16.8% |
Occidental | 17 501 | 19 093 | 1.9% | 9.1% |
Mayfair | 14 699 | 17 664 | 1.7% | 20.2% |
Kenya Orient | 15 208 | 16 964 | 1.7% | 11.5% |
Geminia | 12 524 | 14 699 | 1.4% | 17.4% |
Fidelity Shield | 12 617 | 14 572 | 1.4% | 15.5% |
Kenyan Alliance | 11 106 | 14 089 | 1.4% | 26.9% |
Madison | 11 704 | 12 883 | 1.3% | 10.1% |
Cannon | 12 443 | 12 307 | 1.2% | -1.1% |
Xplico | 6 312 | 11 806 | 1.2% | 87% |
Saham | 7 195 | 9 945 | 1% | 38.2% |
Intra Africa | 8 490 | 9 568 | 0.9% | 12.7% |
Pacis | 8 228 | 9 561 | 0.9% | 16.2% |
Tausi | 8 494 | 9 438 | 0.9% | 11.1% |
Trident | 7 891 | 8 799 | 0.9% | 11.5% |
Gateway | 5 180 | 6 356 | 0.6% | 22.7% |
Takaful | 5 002 | 5 601 | 0.6% | 12% |
Monarch | 3 818 | 5 516 | 0.5% | 44.5% |
Phoenix | 4 745 | 5 438 | 0.5% | 14.6% |
Corporate | 3 764 | 3 940 | 0.4% | 4.7% |
Pioneer | 319 | - | - | - |
Total non life | 834 685 | 1 018 106 | 100% | 22% |
Turnover per life company 2012-2013
in thousands USD| 2012 | 2013 | 2013 shares | 2012-2013 evolution | |
|---|---|---|---|---|
Britam | 77 416 | 94 320 | 18.2% | 21.8% |
Jubilee | 64 125 | 80 088 | 15.5% | 24.9% |
ICEA Lion Life | 57 488 | 75 856 | 14.7% | 32% |
Pan Africa Life | 67 468 | 65 452 | 12.7% | -3% |
CFC Life | 35 971 | 40 013 | 7.7% | 11.2% |
CIC Life | 28 648 | 35 287 | 6.8% | 23.2% |
Kenindia | 23 955 | 24 889 | 4.8% | 3.9% |
UAP Life | 15 217 | 21 810 | 4.2% | 43.3% |
Old Mutual | 15 843 | 19 944 | 3.9% | 25.9% |
Madison | 13 779 | 14 524 | 2.8% | 5.4% |
Pioneer | 10 947 | 11 941 | 2.3% | 9.1% |
APA Life | 5 471 | 8 649 | 1.7% | 58.1% |
GA Life | - | 8 551 | 1.7% | - |
Kenyan Alliance | 1 912 | 3 652 | 0.7% | 91% |
Corporate | 2 164 | 2 407 | 0.5% | 11.2% |
Metropolitan Life | 2 150 | 2 401 | 0.4% | 11.7% |
Cannon | 1 884 | 1 909 | 0.4% | 1.4% |
Saham | 1 675 | 1 804 | 0.3% | 7.7% |
Shield | 1 752 | 1 463 | 0.3% | -16.5% |
First Assurance | 716 | 818 | 0.2% | 14.2% |
Geminia | 438 | 653 | 0.1% | 49.1% |
Monarch | 271 | 570 | 0.1% | 110.2% |
Capex | 143 | 174 | - | 21% |
Total life | 429 433 | 517 175 | 100% | 20.4% |
Turnover per life and non life class of business 2012-2013
in thousands USD| 2012 | 2013 | 2013 shares | ||
|---|---|---|---|---|
| non life insurance | ||||
Aviation | 9 292 | 13 401 | 0.9% | |
Engineering | 30 372 | 34 443 | 2.2% | |
Fire | 97 429 | 112 240 | 7.3% | |
Third party liability | 16 204 | 19 075 | 1.2% | |
Marine | 30 440 | 33 635 | 2.2% | |
Motor | 352 034 | 397 076 | 25.9% | |
Personal accident | 35 683 | 38 574 | 2.5% | |
Health | 152 671 | 244 623 | 15.9% | |
Workmen’s compensation(WIBA) (1) | 48 556 | 54 758 | 3.6% | |
Miscellaneous (2) | 62 004 | 70 281 | 4.6% | |
Total non life | 834 685 | 1 018 106 | 66.3% | |
| Life insurance | ||||
Ordinary life | 117 157 | 130 669 | 8.5% | |
Group life | 136 154 | 164 425 | 10.7% | |
Others (3) | 176 122 | 222 081 | 14.5% | |
Total life | 429 433 | 517 175 | 33.7% | |
Grand total | 1 264 118 | 1 535 281 | 100% | |
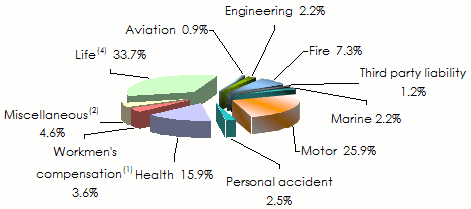
Turnover per class of business in 2013
 1 Work Injury Benefits Act
 2 includes theft
3 includes pension
4 includes ordinary life insurance, group insurance and others Source: AKI (Association of Kenya Insurers)
Exchange rate KES/USD as at 31/12 | 2012 | 2013 |
0.01168 | 0.01175 |