Kenya 2014
Turnover per non life company: 2013-2014
in thousands USD| 2013 | 2014 | 2014 shares | 2013-2014 evolution | |
|---|---|---|---|---|
CIC General | 94 684 | 107 276 | 9.5% | 13.3% |
Jubilee | 101 796 | 103 690 | 9.2% | 1.9% |
APA Insurance | 77 009 | 87 639 | 7.8% | 13.8% |
UAP Insurance | 90 311 | 84 596 | 7.5% | -6.3% |
ICEA Lion General | 53 621 | 59 004 | 5.2% | 10% |
Britam | 44 961 | 56 162 | 5% | 24.9% |
AIG Kenya | 41 180 | 45 231 | 4% | 9.8% |
Heritage | 41 702 | 45 218 | 4% | 8.4% |
GA Assurance | 36 292 | 42 862 | 3.8% | 18.1% |
AAR Insurance | 30 784 | 40 051 | 3.6% | 30.1% |
First Assurance | 38 102 | 38 803 | 3.5% | 1.8% |
Real | 29 815 | 36 188 | 3.2% | 21.4% |
Kenindia | 32 613 | 29 714 | 2.6% | -8.9% |
Amaco | 25 811 | 28 744 | 2.6% | 11.4% |
Resolution | 24 038 | 28 377 | 2.5% | 18% |
Directline | 26 142 | 26 673 | 2.4% | 2% |
Invesco | 21 006 | 23 820 | 2.1% | 13.4% |
Kenya Orient | 16 964 | 21 782 | 1.9% | 28.4% |
Occidental | 19 093 | 20 692 | 1.8% | 8.4% |
Mayfair | 17 664 | 19 701 | 1.8% | 11.5% |
Madison | 12 883 | 17 055 | 1.5% | 32.4% |
Geminia | 14 699 | 16 924 | 1.5% | 15.1% |
Fidelity Shield | 14 572 | 16 768 | 1.5% | 15.1% |
Xplico | 11 806 | 15 802 | 1.4% | 33.9% |
Kenyan Alliance | 14 089 | 14 645 | 1.3% | 4% |
Cannon | 12 307 | 13 649 | 1.2% | 10.9% |
Saham | 9 945 | 11 683 | 1% | 17.5% |
Trident | 8 799 | 11 091 | 1% | 26% |
Pacis | 9 561 | 11 057 | 1% | 15.6% |
Intra Africa | 9 568 | 9 868 | 0.9% | 3.1% |
Tausi | 9 438 | 9 119 | 0.8% | -3.4% |
Gateway | 6 356 | 8 190 | 0.7% | 28.9% |
Takaful | 5 601 | 7 612 | 0.7% | 35.9% |
The Monarch | 5 516 | 6 819 | 0.6% | 23.6% |
Phoenix | 5 438 | 5 138 | 0.5% | -5.5% |
Corporate | 3 940 | 4 107 | 0.4% | 4.2% |
Total non life companies | 1 018 106 | 1 125 750 | 100% | 10.6% |
Turnover per life company: 2013-2014
in thousands USD| 2013 | 2014 | 2014 shares | 2013-2014 evolution | |
|---|---|---|---|---|
Jubilee | 80 088 | 124 175 | 19.4% | 55% |
Britam | 94 320 | 113 572 | 17.8% | 20.4% |
ICEA Lion Life | 75 856 | 76 613 | 12% | 1% |
Pan Africa Life | 65 452 | 62 631 | 9.8% | -4.3% |
Liberty (1) | 40 013 | 49 570 | 7.7% | 23.9% |
CIC Life | 35 287 | 46 070 | 7.2% | 30.6% |
Pioneer | 11 941 | 30 327 | 4.7% | 154% |
UAP Life | 21 810 | 29 131 | 4.6% | 33.6% |
Kenindia | 24 889 | 28 443 | 4.4% | 14.3% |
Old Mutual Life | 19 944 | 18 477 | 2.9% | -7.4% |
Madison | 14 524 | 16 319 | 2.6% | 12.4% |
APA Life | 8 649 | 11 511 | 1.8% | 33.1% |
GA Life | 8 551 | 8 383 | 1.3% | -2% |
Kenyan Alliance | 3 652 | 4 594 | 0.7% | 25.8% |
Metropolitan Life | 2 401 | 4 295 | 0.7% | 78.9% |
Cannon | 1 909 | 3 842 | 0.6% | 101.2% |
Corporate | 2 406 | 2 697 | 0.4% | 12.1% |
Kenya Orient Life | - | 2 272 | 0.4% | - |
Saham | 1 804 | 1 901 | 0.3% | 5.4% |
Prudential Life (2) | 1 463 | 1 832 | 0.3% | 25.2% |
First Assurance | 818 | 1 489 | 0.2% | 82% |
Geminia | 653 | 875 | 0.1% | 33.9% |
Monarch | 570 | 588 | 0.1% | 3.2% |
Capex | 174 | 240 | - | 38.2% |
Total life companies | 517 174 | 639 847 | 100% | 23.7% |
Turnover per life and non life classes of business: 2013-2014
in thousands USD| 2013 | 2014 | 2014 shares | ||
|---|---|---|---|---|
| Non life insurance | ||||
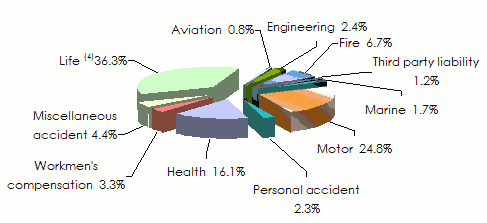
Aviation | 13 401 | 14 409 | 0.8% | |
Engineering | 34 443 | 42 626 | 2.4% | |
Fire | 112 240 | 118 254 | 6.7% | |
Third party liability | 19 075 | 21 967 | 1.2% | |
Marine | 33 635 | 30 659 | 1.7% | |
Motor | 397 076 | 437 795 | 24.8% | |
Personal accident | 38 574 | 39 765 | 2.3% | |
Health | 244 623 | 284 233 | 16.1% | |
Workmen's compensation (WIBA) (1) | 54 758 | 58 646 | 3.3% | |
Others(2) | 70 281 | 77 396 | 4.4% | |
Total non life | 1 018 106 | 1 125 750 | 63.7% | |
| Life insurance | ||||
Group life insurance | 130 669 | 205 852 | 11.7% | |
Ordinary life insurance | 164 425 | 202 490 | 11.5% | |
Others (3) | 222 080 | 231 505 | 13.1% | |
Total life | 517 174 | 639 847 | 36.3% | |
Grand total | 1 535 280 | 1 765 597 | 100% | |
Turnover per class of business in 2014
 (4) including ordinary life insurance, insurance group and others Source: AKI (Association of Kenya Insurers)
Exchange rate KES/USD as at 31/12 | 2013 | 2014 |
0.01175 | 0.01123 |