Morocco 2013
Evolution of life and non life premiums1 2009-2013
in thousands USD| 2009 | 2010 | 2011 | 2012 | 2013 | |
|---|---|---|---|---|---|
Non life | 1 816 022 | 1 823 010 | 1 888 180 | 2 040 986 | 2 250 385 |
Life | 858 003 | 798 008 | 900 728 | 1 049 561 | 1 067 002 |
Total | 2 674 025 | 2 621 018 | 2 788 908 | 3 090 547 | 3 317 387 |
Evolution of life and non life incurred losses and benefits 2009-2013
in thousands USD| 2009 | 2010 | 2011 | 2012 | 2013 | |
|---|---|---|---|---|---|
Non life | 1 198 804 | 1 143 340 | 1 163 516 | 1 213 612 | 1 342 975 |
Life | 505 578 | 606 398 | 694 930 | 696 111 | 787 331 |
Total | 1 704 382 | 1 749 738 | 1 858 446 | 1 909 723 | 2 130 306 |
Evolution of premiums, incurred losses and benefits: 2009-2013
in millions USD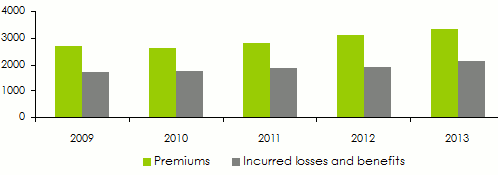
Turnover’ evolution per class of business: 2009-2013
in thousands USD| 2009 | 2010 | 2011 | 2012 | 2013 | 2013 shares | |
|---|---|---|---|---|---|---|
| Non life insurance | ||||||
Bodily injury (1) | 335 047 | 326 753 | 326 769 | 349 238 | 380 807 | 11.5% |
Workmen’s compensation | 233 819 | 226 994 | 228 456 | 242 170 | 265 602 | 8% |
Motor | 841 249 | 847 893 | 879 053 | 952 402 | 1 054 405 | 31.8% |
General third party liability | 54 183 | 54 906 | 57 251 | 56 639 | 63 224 | 1.9% |
Fire and natural catastrophes | 120 281 | 123 736 | 124 038 | 145 290 | 155 783 | 4.7% |
Technical risks | 33 790 | 36 476 | 39 627 | 40 098 | 46 794 | 1.4% |
Marine | 88 330 | 84 636 | 85 206 | 78 072 | 72 891 | 2.2% |
Others | 20 968 | 22 744 | 47 342 | 62 433 | 75 286 | 2.3% |
Assistance, credit, bond | 81 204 | 83 797 | 89 139 | 99 813 | 120 231 | 3.6% |
Acceptances | 7 151 | 15 075 | 11 299 | 14 831 | 15 362 | 0.4% |
Total Non life | 1 816 022 | 1 823 010 | 1 888 180 | 2 040 986 | 2 250 385 | 67.8% |
| Life insurance | ||||||
Ordinary life insurance | 574 203 | 515 653 | 539 959 | 664 564 | 644 313 | 19.4% |
Group life insurance | 168 985 | 183 580 | 201 599 | 240 674 | 246 666 | 7.5% |
Industrial life assurance | 0 | 0 | 23 | 29 | 2 | - |
Capitalisation | 61 398 | 56 080 | 112 868 | 110 844 | 156 068 | 4.7% |
Variable life assurance | 43 776 | 34 475 | 38 529 | 25 993 | 18 948 | 0.6% |
Acceptances | 9 641 | 8 220 | 7 750 | 7 457 | 1 005 | - |
Total life | 858 003 | 798 008 | 900 728 | 1 049 561 | 1 067 002 | 32.2% |
Grand total | 2 674 025 | 2 621 018 | 2 788 908 | 3 090 547 | 3 317 387 | 100% |
Turnover’s breakdown per class of business in 2013
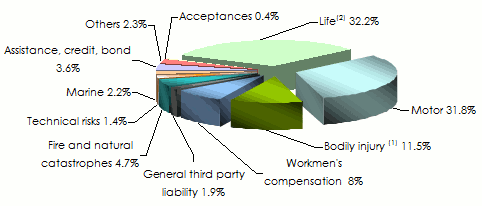 (1)includes health and maternity
 (2) includes ordinary, group and industrial life assurance, capitalisation and variable life assurance
Evolution of technical result per life and non life insurance: 2009-2013
in thousands USD| 2009 | 2010 | 2011 | 2012 | 2013 | ||
|---|---|---|---|---|---|---|
| Non life insurance | ||||||
Bodily injury (1) | 40 971 | 18 072 | 5 788 | - 14 015 | - 20 624 | |
Workmen’s compensation | 102 828 | 109 795 | 46 265 | 4 277 | 55 468 | |
Motor | 247 338 | 440 333 | 333 495 | 248 326 | 363 772 | |
General third party liability | 20 286 | 25 277 | 24 298 | 14 770 | 21 991 | |
Fire and natural catastrophes | 12 121 | 25 404 | 22 507 | 30 428 | 45 941 | |
Technical risks | 4 840 | -1 022 | 11 270 | 5 200 | -13 564 | |
Marine | 25 838 | 25 344 | 23 660 | 19 448 | 587 | |
Others | 12 041 | 9 844 | 13 300 | 1 186 | 4 607 | |
Assistance and credit | 12 858 | 11 355 | 11 425 | 15 264 | 15 007 | |
Total non life | 479 121 | 664 402 | 492 008 | 324 885 | 473 186 | |
| Life insurance | ||||||
Ordinary life insurance | -8 603 | 10 099 | 41 778 | 47 215 | 18 323 | |
Group life insurance | 32 354 | 41 462 | 31 931 | 39 126 | 86 265 | |
Others | - | -24 | - | -21 | -4 226 | |
Total life | 23 751 | 51 538 | 73 709 | 86 319 | 100 362 | |
Grand total | 502 872 | 715 940 | 565 717 | 411 204 | 573 548 | |
Evolution of incurred losses per non life insurance: 2009-2013
in thousands USD| 2009 | 2010 | 2011 | 2012 | 2013 | 2013 shares | |
|---|---|---|---|---|---|---|
| Non life insurance | ||||||
Bodily injury (1) | 225 946 | 247 500 | 251 171 | 270 169 | 302 090 | 14.2% |
Workmen’s compensation | 159 365 | 128 157 | 186 716 | 181 368 | 194 131 | 9.1% |
Motor | 617 352 | 549 247 | 546 804 | 577 483 | 616 515 | 29% |
General third party liability | 45 395 | 20 933 | 11 936 | 16 384 | 13 251 | 0.6% |
Fire and natural catastrophes | 47 179 | 69 148 | 57 755 | 40 729 | 34 959 | 1.6% |
Technical risks | 28 942 | 31 360 | 6 310 | 6 564 | 40 487 | 1.9% |
Marine | 31 277 | 39 907 | 29 630 | 37 857 | 32 268 | 1.5% |
Others | 6 256 | 11 990 | 25 697 | 30 000 | 39 302 | 1.8% |
Assistance and credit | 37 092 | 45 098 | 47 497 | 53 059 | 69 972 | 3.3% |
Total non life | 1 198 804 | 1 143 340 | 1 163 516 | 1 213 612 | 1 342 975 | 63% |
| Life insurance | ||||||
Ordinary life insurance | 280 024 | 361 071 | 452 849 | 24 814 | 431 078 | 20.2% |
Group life insurance | 225 554 | 245 305 | 242 081 | 271 277 | 275 707 | 13% |
Others | - | 22 | - | 20 | 80 546 | 3.8% |
Total life | 505 578 | 606 398 | 694 930 | 696 111 | 787 331 | 37% |
Grand total | 1 704 382 | 1 749 738 | 1 858 446 | 1 909 723 | 2 130 306 | 100% |
Evolution of non life loss ratios: 2009-2013
| 2009 | 2010 | 2011 | 2012 | 2013 | |
|---|---|---|---|---|---|
Bodily injury (1) | 67.3% | 75.5% | 70.1% | 77.1% | 79.4% |
Workmen’s compensation | 68.2% | 56.4% | 74.8% | 75.3% | 73.2% |
Motor | 74.7% | 66.7% | 56.3% | 60.7% | 59.7% |
General third party liability | 86.7% | 39% | 20.3% | 29.2% | 21.2% |
Fire and natural catastrophes | 39.6% | 56.4% | 40.0% | 28.2% | 22.8% |
Technical risks | 91.8% | 98.5% | 17.1% | 18.1% | 103.2% |
Marine | 34.5% | 46.9% | 43.5% | 48.5% | 44.6% |
Other operations | 27.9% | 37.8% | 36.2% | 48.2% | 52% |
Assistance and credit | 46.5% | 54.3% | 43.1% | 53.4% | 59.7% |
Total Non life | 66.9% | 64% | 56.2% | 60.1% | 61.1% |
Evolution of turnover per life and non life company: 2009-2013
in thousands USD| 2009 | 2010 | 2011 | 2012 | 2013 | 2012/2013 evolution | 2013 shares | |
|---|---|---|---|---|---|---|---|
Wafa Assurance | 548 867 | 514 055 | 616 306 | 680 149 | 712 003 | 4.7% | 21.5% |
RMA Watanya | 537 119 | 524 798 | 511 070 | 603 805 | 598 973 | -0.8% | 18.1% |
Axa Assurance Maroc | 390 915 | 390 911 | 382 130 | 413 465 | 452 618 | 9.5% | 13.6% |
Saham Assurance | 361 391 | 356 338 | 354 595 | 383 222 | 434 526 | 13.4% | 13.1% |
Sanad | 152 410 | 145 941 | 150 977 | 170 819 | 181 395 | 6.2% | 5.5% |
Atlanta | 144 518 | 142 502 | 141 348 | 158 114 | 178 541 | 12.9% | 5.4% |
MCMA | 96 196 | 89 597 | 136 084 | 146 454 | 177 883 | 21.5% | 5.4% |
Zurich | 104 816 | 109 453 | 122 568 | 128 299 | 137 119 | 6.9% | 4.1% |
Marocaine vie | 108 941 | 110 112 | 117 957 | 128 322 | 125 455 | -2.2% | 3.8% |
MAMDA | 42 013 | 48 627 | 64 768 | 74 676 | 89 990 | 20.5% | 2.7% |
CAT | 80 196 | 79 363 | 77 292 | 78 024 | 80 497 | 3.2% | 2.4% |
Maroc Assistance | 35 169 | 37 591 | 38 051 | 42 390 | 48 569 | 14.6% | 1.5% |
Isaaf Mondiale Assistance | 36 203 | 35 649 | 36 031 | 35 301 | 36 929 | 4.6% | 1.1% |
MATU | 26 025 | 25 859 | 25 118 | 25 422 | 27 461 | 8.0% | 0.8% |
Wafa Ima Assistance | - | - | 770 | 7 730 | 13 228 | 71.1% | 0.4% |
Euler Hermes ACMAR | 6 194 | 6 639 | 9 606 | 8 727 | 11 230 | 28.7% | 0.3% |
Axa Assistance Maroc | 3 052 | 3 583 | 4 237 | 5 628 | 10 970 | 94.9% | 0.3% |
Grand total | 2 674 025 | 2 621 018 | 2 788 908 | 3 090 547 | 3 317 387 | 7.3% | 100% |
Exchange rate MAD/USD as at 31/12 | 2009 | 2010 | 2011 | 2012 | 2013 |
0.1277 | 0.11983 | 0.11672 | 0.11874 | 0.12409 |