Non-life reinsurers’ profitability
 The situation is all the more precarious with the positive development of reserves, observed until then, likely to help improve the return rate. However, the impact of this development on ROE and the combined ratio is becoming increasingly weak.
The current pandemic will leave its mark on reinsurers who are finding it increasingly difficult to achieve their ROE objective. The latter should be set between 0% and 3% in 2020 with hope of recovery in 2021.
The graph below shows the returns on capital which have fallen sharply in the first and second quarters of 2020 at 3.2% and 2.1% respectively while the average cost of capital has risen above 7% compared to 6% in the year 2019.
Reinsurers: Return and average cost of capital
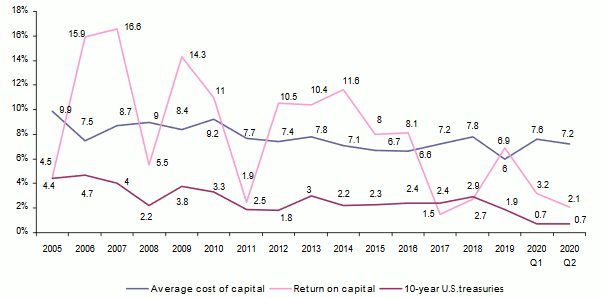
Sources : S&P, Bloomberg
Read also | Reinsurance treaties' renewal in 2021
Non-life reinsurers: combined ratio
The average non-life combined ratio has reached or exceeded 100% since 2017. Natural events had profoundly affected the market in 2017 and 2018. The first measures taken by reinsurers have reduced the cost ratio whereas the positive effect of reserve developments has slowed down.
The health crisis that persists with the arrival of the second wave is likely to inflate the list of coronavirus-related claims. The effect of Covid-19 on the results of reinsurance companies will therefore be felt for some time to come.
The third quarter of 2020 will also provide an indication of the impact of major natural catastrophe claims particularly Hurricane Laura which hit the Caribbean and then the southern coast of Louisiana at the end of August. The insured losses caused by this event in the United States are estimated at more than 14 billion USD.
The effects of the tightening of reinsurance conditions on 1 July will partly offset the consequences of the health crisis and natural catastrophe claims. Nevertheless, this will be far from sufficient.
Despite this loss experience, the combined ratios for the year 2020 are expected to range between 103% and 108%. Subject to an improvement in the health crisis, these combined ratios could be between 97% -101% in 2021.
Non-life reinsurers: Evolution of technical ratios (2015-2019)
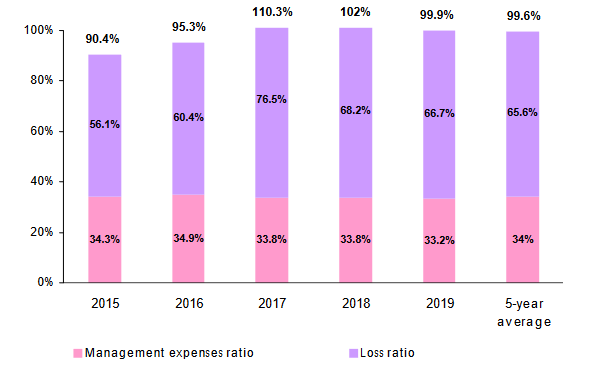
Source : AM Best
Non-life reinsurers’ results
The results published by reinsurers in the first quarter of 2020 show a sharp decline in profits compared to the previous year. According to the industry aggregation index conducted by broker AON, which includes 23 reinsurers, losses amounted to 1.1 billion USD for the first six months of the year.
The combined ratio of non-life reinsurers included in the index is 104.1%, 9.7% of which is due to the health crisis, that is 8.2 billion USD. Still according to broker AON, Covid-19 would also have caused a loss of 1 billion USD in life insurance.
The comparison of reinsurance results by geographical area over a long period leads to disparate results. The table below compares reinsurers' results according to key factors such as: premiums, investments, profits, loss ratio, combined ratios, returns on equity, reserve evolution.
ROE for the market as a whole has been on a downward trend, especially between 2013 and 2018, from 13% at 1.1%. During the same period, profits collapse from 24.7 billion to 2.2 billion USD. However, revenues, as a whole, remain more or less stable between 2013 and 2018. The good results of the year 2019, exempt from major catastrophes, provide a much-needed oxygen balloon to reinsurers.
Not surprisingly, we note that the four leaders in the sector, Swiss Re, Munich Re, Hannover Re and SCOR, have posted an average ROE over the last five years of 7.4%. This rate is higher than that obtained by the "Bermudans", the American reinsurers (5.1%) and the London market (3%). It is also interesting to note that the "big four" generally have a lower ROE than Bermudan reinsurers and the London market in good years, but higher in bad years. This lower volatility gives more stability to the results of the leaders.
Non-life reinsurance market: Main highlights 2013-2019
In billions USD| Highlights | 2013 | 2014 | 2015 | 2016 | 2017 | 2018 | 2019 | 5-year average |
|---|---|---|---|---|---|---|---|---|
Net non-life written premiums | 144.2 | 140.4 | 131.7 | 130.3 | 144.5 | 150 | 167.3 | 144.7 |
Net non-life earned premiums | 140 | 135.7 | 129.7 | 128 | 143.3 | 147.3 | 162.3 | 142.1 |
Net investment income | 22.6 | 23 | 18.9 | 20.4 | 25.8 | 16.1 | 28.2 | 21.9 |
Total revenues | 232.2 | 222.5 | 210.3 | 216.4 | 238.8 | 223.8 | 263.8 | 230.6 |
Net results | 24.7 | 22.9 | 18.5 | 16.7 | 0.3 | 2.2 | 20.9 | 11.7 |
Shareholder’s equity | 191.5 | 205.7 | 200.2 | 204.2 | 207.8 | 191.4 | 225.3 | 205.8 |
Loss ratio in % | 55.9 | 56.2 | 56.1 | 60.4 | 76.5 | 68.2 | 66.7 | 65.6 |
Management expenses in % | 31.9 | 33.5 | 34.3 | 34.9 | 33.8 | 33.8 | 33.2 | 34 |
Combined ratio in % | 87.9 | 89.7 | 90.4 | 95.3 | 110.3 | 101.9 | 99.9 | 99.6 |
ROE in % (Return on Equity) | 13 | 11.6 | 9.2 | 8.4 | 0.1 | 1.1 | 9.8 | 5.7 |
ROR in % (Return on Revenue) | 10.7 | 10.3 | 8.8 | 7.7 | 0.1 | 1 | 7.9 | 5.1 |
Source: AM Best
