Oman 2012
Breakdown of written premiums per class of business: 2011-2012
in USD| 2011 | 2012 | 2011/2012 evolution | 2012 shares | |
|---|---|---|---|---|
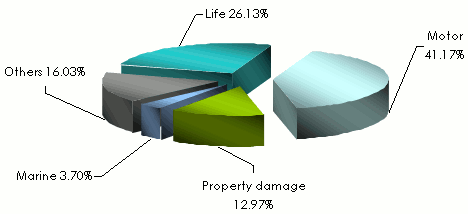
Motor | 299 151 002 | 352 841 609 | 17.94% | 41.17% |
Property damage | 108 221 061 | 111 051 885 | 2.61% | 12.97% |
Marine | 45 522 174 | 31 637 811 | 30.50% | 3.70% |
Others | 117 300 749 | 137 284 790 | 17.04% | 16.03% |
Total non life | 570 194 986 | 632 816 095 | 10.98% | 73.87% |
Life | 158 303 842 | 223 875 941 | 41.42% | 26.13% |
Grand total | 728 498 828 | 856 692 036 | 17.59% | 100% |
Premiums split per class of business in 2012
Breakdown of premiums per company in 2012
in USD| 2011 | 2012 | 2011-2012 evolution | 2012 shares | |
|---|---|---|---|---|
Dhofar Insurance Company | 135 377 184 | 141 087 052 | 4.21% | 16.47% |
National Life Insurance and General | 91 726 971 | 114 007 103 | 24.28% | 13.31% |
Oman United Insurance | 78 891 446 | 94 483 224 | 19.76% | 11.03% |
Al Ahlia Insurance Company | 76 902 541 | 86 515 693 | 12.50% | 10.10% |
New India Assurance | 61 506 597 | 67 945 111 | 10.46% | 7.93% |
Oman & Qatar Insurance | 37 210 015 | 48 136 633 | 29.36% | 5.62% |
Axa Insurance | 31 699 001 | 46 054 837 | 45.28% | 5.38% |
Al Madina Gulf Insurance | 36 329 057 | 43 880 531 | 20.78% | 5.12% |
Vision Insurance | 27 991 957 | 31 912 585 | 14.00% | 3.73% |
Arabia Insurance | 20 415 841 | 28 749 075 | 40.81% | 3.35% |
Falcon Insurance | 25 137 217 | 27 686 095 | 10.13% | 3.23% |
Oman Insurance | 13 201 547 | 27 174 955 | 105.84% | 3.17% |
Muscat Insurance | 21 430 668 | 23 540 029 | 9.84% | 2.75% |
Metlife Alico Insurance | 20 271 246 | 22 172 535 | 9.37% | 2.59% |
Zurich Middle East | 7 312 957 | 13 410 670 | 83.38% | 1.57% |
Arab Orient | 10 091 457 | 9 586 425 | -5.00% | 1.12% |
Muscat Life Insurance | 13 972 678 | 9 374 889 | -32.90% | 1.09% |
Chartis Memsa | 5 247 686 | 8 594 547 | 63.77% | 1.00% |
Life Insurance Corporation International | 6 092 104 | 4 575 806 | -24.88% | 0.53% |
Iran Insurance | 3 960 478 | 4 325 960 | 9.22% | 0.50% |
Saudi Arabian Insurance | 3 730 180 | 3 478 281 | 6.75% | 0.41% |
Grand total | 728 498 828 | 856 692 036 | 17.59% | 100% |
Exchange rate OMR/TND as at 31/12 | 2011 | 2012 |
2.60512 | 2.59875 |