Santam
 With interests in several African countries, the United Kingdom and Ireland, Santam is aiming at becoming a global group.
Following the average 2008 results, the insurer managed to bounce back in 2009, posting a turnover on the rise by 35.2% and good financial indicators. In May 2009, South Africa's Financial Intermediaries Association (FIA) granted Santam the award for the market's best non-life insurer.
The 2008 setback is a thing of the past now, and the group has been posting outstanding performances in tune with its status as an African giant.
 |  |
| Desmond Smith | Ian Kirk |
| Chairman | Chief Executive |
Santam in 2009
| Capital | 14 425 740 USD |
| Turnover | 2 025 805 320 USD |
| Shareholder's equity | 665 875 980 USD |
| Assets | 2 302 995 240 USD |
| Net result after tax | 150 459 120 USD |
| Technical result | 214 228 980 USD |
| ROE | 22.6% |
| Loss ratio | 70.6% |
| Combined ratio | 94.2% |
| Number of branches | 2 (South Africa and Namibia) |
| Number of employees | 2783 (South Africa) |
Management
| Chief executive | Ian kirk |
| Chief financial officer | Machiel Reyneke |
| Executive head — Risk services | Hendri Nigrini |
| Insurance sevices manager | Hennie Nortje |
| Executive Head — Broker distribution | Edward Gibbens |
| Executive head — Market development | Temba Mvusi |
| Executive head — People & brand services | Yegs Ramiah |
| Executive head — Information management | Jan de Klerk |
| Executive head — Specialist business | Quinten Matthew |
Main shareholders
| Sanlam Limited | 54.87% |
| Central Plaza Investments 112 (Pty) | 9.59% |
| Guardian National Insurance Limited | 5.58% |
Main technical highlights of Santam Group: 2005-2009
in USD| 2005 | 2006 | 2007 | 2008 | 2009 | |
|---|---|---|---|---|---|
Gross written premiums | 1 789 320 900 | 1 717 180 100 | 1 921 808 970 | 1 498 011 350 | 2 025 805 320 |
Written premiums net of reinsurance | 1 472 427 520 | 1 432 140 960 | 1 592 972 910 | 1 254 382 450 | 1 738 369 080 |
Net earned premiums | 1 397 892 180 | 1 368 074 480 | 1 563 357 240 | 1 237 795 400 | 1 738 638 720 |
Net incurred losses | 912 860 940 | 938 318 800 | 1 065 288 780 | 845 939 550 | 1 226 862 000 |
Net loss ratios | 65.3% | 68.6% | 68.1% | 68.3% | 70.6% |
Management expenses | 433 817 740 | 396 163 300 | 450 070 650 | 353 187 950 | 485 621 640 |
Technical results | 349 197 280 | 324 868 080 | 256 036 950 | 98 677 100 | 214 228 980 |
Net results | 283 801 580 | 264 628 580 | 156 977 640 | 78 709 250 | 150 459 120 |
Evolution of premiums, losses, management expenses and results
in millions USD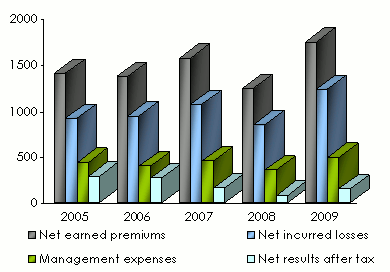
Th turnover's evolution of the Group per class of business: 2005-2009
in USD| 2005 | 2006 | 2007 | 2008 | 2009 | 2009 shares | 08/09 growth | |
|---|---|---|---|---|---|---|---|
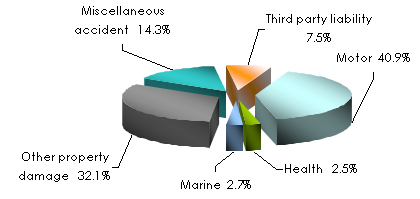
Motor | 728 019 600 | 648 318 760 | 720 842 490 | 584 772 750 | 828 738 540 | 40,9% | 41,7% |
Health | 49 637 700 | 44 789 840 | 48 289 590 | 39 935 700 | 51 501 240 | 2,5% | 29% |
Marine | 42 861 760 | 41 104 600 | 50 040 270 | 41 626 100 | 53 658 360 | 2,7% | 28,9% |
Other damage | 622 283 420 | 595 308 000 | 616 677 030 | 464 648 700 | 650 910 960 | 32,1% | 40,1% |
Misc. accident | 234 321 460 | 272 991 240 | 330 149 070 | 247 643 600 | 289 188 900 | 14,3% | 16,8% |
TPL | 112 196 960 | 114 667 660 | 155 810 520 | 119 384 500 | 151 807 320 | 7,5% | 27,2% |
Grand total | 1 789 320 900 | 1 717 180 100 | 1 921 808 970 | 1 498 011 350 | 2 025 805 320 | 100% | 35,2% |
Breakdown per class of business in 2009
Ratios' evolution: 2005-2009
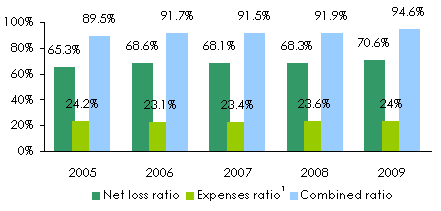 1 Management expenses on gross written premiums
 Exchange rate ZAR/USD as at 31/12 | 2005 | 2006 | 2007 | 2008 | 2009 |
0.15758 | 0.14174 | 0.14589 | 0.10565 | 0.13482 |

Contact
| Head office | 1 Sportica Crescent, Tyger Valley Bellville 7530 PO Box 3881 Tyger Valley 7536 - South Africa |
| Phone | (+27) 21 915 7000 |
| Fax | (+27) 21 914 0700 |
info [at] santam [dot] co [dot] za | |
| Website |