Saudi United Cooperative Insurance Company (WALA’A)

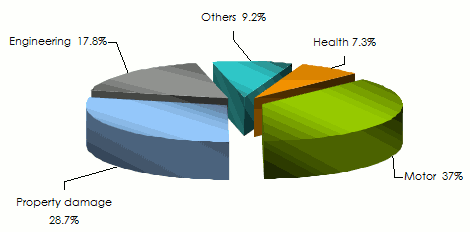
In 2015, that is nearly 9 years after its starting, Wala'a is still considered as a medium-sized company in the Saudi market dominated by giant Tawuniya, followed by Medgulf, Bupa and UCA. The turnover of the company is driven by motor insurance which in 2014 accounted for 37% of all underwritings.
Damage to property and Engineering classes of business, on their part, respectively account for 28.7% and 17.8% of turnover.
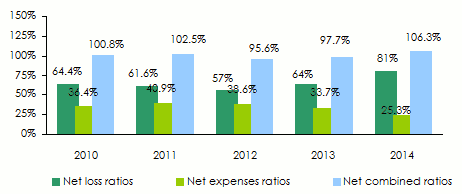
Like all other players on the market, Wala'a has gone through difficult periods, alternating losses and profits. The combined ratio is around and sometimes exceeds 100% over the past five years.
Thanks to its enormous potential, Saudi Arabia remains a promising market despite results that are not up to the expectations of local insurers.
 |  |
| Sulaiman Al-Kadi | Johnson Varughese |
| Chairman of the board | Chief Executive Officer |
WALA'A in 2014
| Share capital | 53 306 000 USD |
| Turnover | 173 141 365 USD |
| assets | 237 222 361 USD |
| Shareholders’ equity | 44 880 465 USD |
| Net loss | 10 231 686 USD |
| Net loss ratio | 81% |
| Net expenses ratio | 25.3% |
| Net combined ratio | 106.3% |
| Regional offices | 3 |
| Employees | 62 |
Board of directors and management
| Chairman of the board | Sulaiman Al-Kadi |
| Chief Executive Officer | Johnson Varughese |
| Chief financial officer (CFO) | Phanindra Kumar Krishnaswamy |
| Vice President, Technical | Wasif F. Minhas |
| Vice President, Sales and Marketing | Salah Mohammed Al Jaber |
| Human Resources and Adminstration Manager | Turki Al-Buraik |
| IT Manager | G. Sridhar |
| Underwriting Manager | Mannan Mehboob |
Main shareholders
| Saudi Stock Exchange | 40% |
| Global General Insurance Co. | 10.5% |
| Yousuf S. A. Al Rajhi | 5.1% |
Main technical highlights: 2010-2014
Figures in USD
| 2010 | 2011 | 2012 | 2013 | 2014 | |
|---|---|---|---|---|---|
Gross written premiums | 58 673 341 | 74 289 278 | 62 498 082 | 92 581 927 | 173 141 365 |
Written premiums(1) | 40 571 471 | 41 019 724 | 42 349 370 | 51 570 041 | 89 296 626 |
Net earned premiums | 31 633 797 | 43 852 260 | 47 485 495 | 40 621 285 | 68 546 513 |
Net incurred losses | 20 375 948 | 27 009 134 | 27 057 411 | 25 979 577 | 55 495 727 |
Management expense(2) | 14 768 710 | 16 771 317 | 16 336 058 | 17 411 026 | 22 606 954 |
Net loss ratio | 64.4% | 61.6% | 57% | 64% | 81% |
Net expenses ratio(3) | 36.4% | 40.9% | 38.6% | 33.7% | 25.3% |
Net combined ratio | 100.8% | 102.5% | 95.6% | 97.7% | 106.3% |
Net technical result | -1 674 646 | 1 603 691 | 4 057 801 | 69 934 | -9 572 552 |
Loss / net profit | -1 085 346 | 1 162 086 | 5 513 566 | 8 436 948 | -10 231 686 |
(1)net of reinsurance
(2)including acquisition costs
(3)net expenses ratio = management expenses / written premiums net of reinsurance
Evolution of premiums, losses and results: 2010-2014
in thousands USD 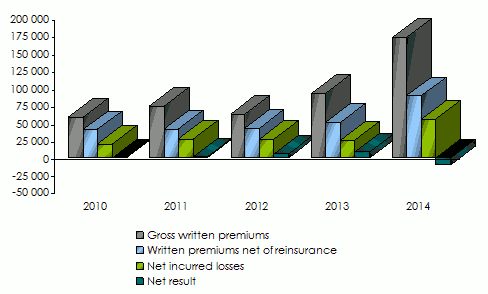
Evolution of ratios: 2010-2014
Breakdown of turnover per class of business: 2010-2014
in USD
| 2010 | 2011 | 2012 | 2013 | 2014 | 2014 shares | |
|---|---|---|---|---|---|---|
Health | 9 732 751 | 26 279 953 | 17 275 016 | 11 868 760 | 12 594 824 | 7.3% |
Motor | 30 355 364 | 16 912 154 | 15 905 152 | 28 487 510 | 64 096 631 | 37% |
Property damage | 5 756 373 | 7 587 898 | 14 546 424 | 32 585 020 | 49 691 885 | 28.7% |
Engineering | - | - | - | - | 30 766 670 | 17.8% |
Others | 12 828 853 | 23 509 273 | 14 771 490 | 19 640 637 | 15 991 355 | 9.2% |
Total | 58 673 341 | 74 289 278 | 62 498 082 | 92 581 927 | 173 141 365 | 100% |
Breakdown of turnover per class of business in 2014
Net earned premiums: 2010-2014
in USD
| 2010 | 2011 | 2012 | 2013 | 2014 | |
|---|---|---|---|---|---|
Health | 4 614 659 | 7 724 657 | 20 961 414 | 11 367 863 | 12 903 596 |
Motor | 21 792 903 | 26 385 405 | 16 239 784 | 18 751 637 | 43 703 308 |
Property damage | 459 913 | 757 146 | 687 679 | 1 020 891 | 1 815 651 |
Engineering | - | - | - | 851 987 | 1 208 849 |
Others | 4 766 322 | 8 985 052 | 9 596 618 | 8 628 907 | 8 915 109 |
Total | 31 633 797 | 43 852 260 | 47 485 495 | 40 621 285 | 68 546 513 |
Net incurred losses: 2010-2014
in USD
| 2010 | 2011 | 2012 | 2013 | 2014 | 2014 shares | |
|---|---|---|---|---|---|---|
Health | 3 065 140 | 3 187 022 | 7 133 011 | 4 943 822 | 6 740 877 | 12.1% |
Motor | 15 589 151 | 20 511 787 | 15 614 117 | 16 859 868 | 42 378 327 | 76.4% |
Property damage | 227 886 | 370 320 | 398 787 | 1 959 276 | 1 275 050 | 2.3% |
Engineering | - | - | - | 2 183 | 1 452 517 | 2.6% |
Others | 1 493 771 | 2 940 005 | 3 911 496 | 2 214 428 | 3 648 956 | 6.6% |
Total | 20 375 948 | 27 009 134 | 27 057 411 | 25 979 577 | 55 495 727 | 100% |
Non life net loss ratios: 2010-2014
| 2010 | 2011 | 2012 | 2013 | 2014 | |
|---|---|---|---|---|---|
Health | 66.4% | 41.3% | 34% | 43.5% | 52.2% |
Motor | 71.5% | 77.7% | 96.1% | 89.9% | 97% |
Property damage | 49.5% | 48.9% | 58% | 191.9% | 70.2% |
Engineering | - | - | - | 0.3% | 120.2% |
Others | 31.3% | 32.7% | 40.8% | 25.7% | 40.9% |
Total | 64.4% | 61.6% | 57% | 64% | 81% |
Sources: Balance sheets of «SAUDI UNITED COOPERATIVE INSURANCE COMPANY (WALA’A)»
Exchange rates as at 31/12 | 2010 | 2011 | 2012 | 2013 | 2014 |
0.26670 | 0.26669 | 0.26698 | 0.26666 | 0.26653 |

Contact
| Head office | Khobar King Abdullah Road, Buidling Rabiah & Nasser, Dhahran Street, BP 31616, Al-Khobar 31952, Saudi Arabia |
| Phone | +966 38 652 200 |
| Fax | +966 38 652 255 |
walaa [at] walaa [dot] com (walaa [at] walaa [dot] com ) | |
| Website |