Senegal 2012
Breakdown of non life turnover per company
in thousands USD| 2011 | 2012 | 2011/2012 evolution | 2012 shares | |
|---|---|---|---|---|
AXA | 24 125 | 23 649 | -2.0% | 16.5% |
ALLIANZ | 19 376 | 19 525 | 0.8% | 13.6% |
AMSA | 11 787 | 12 400 | 5.2% | 8.6% |
NSIA | 14 528 | 11 880 | -18.2% | 8.3% |
PA | 12 937 | 11 588 | -10.4% | 8.1% |
SONAM Sa | 9 738 | 10 335 | 6.1% | 7.2% |
COLINA | 7 571 | 10 214 | 34.9% | 7.1% |
CNART | 8 601 | 9 555 | 11.1% | 6.7% |
SONAM Mutuelle | 7 583 | 7 138 | -5.9% | 5.0% |
ASKIA | 6 133 | 6 686 | 9.0% | 4.7% |
CGA | 4 527 | 6 429 | 42.0% | 4.5% |
SALAMA | 6 006 | 5 874 | -2.2% | 4.1% |
ASS | 6 278 | 5 623 | -10.4% | 3.9% |
SONAC | 2 434 | 1 759 | -27.7% | 1.2% |
CNAAS | - | 434 | - | 0.3% |
MAAS | 213 | 325 | 52.7% | 0.2% |
Total | 141 836 | 143 413 | 1.1% | 100% |
Breakdown of life turnover per company
in thousands USD| 2011 | 2012 | 2011/2012 evolution | 2012 shares | |
|---|---|---|---|---|
SONAM-VIE | 12 088 | 12 157 | 0.6% | 28.0% |
ALLIANZ-VIE | 8 534 | 8 981 | 5.2% | 20.7% |
UASen-VIE | 7 403 | 8 069 | 9.0% | 18.5% |
NSIA VIE | 4 762 | 6 103 | 28.2% | 14.0% |
AMSA - VIE | 10 036 | 5 403 | -46.2% | 12.4% |
SAAR VIE | 3 022 | 2 784 | -7.9% | 6.4% |
Total | 45 847 | 43 497 | -5.1% | 100% |
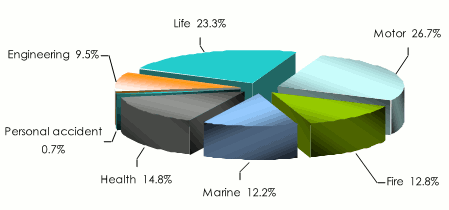
Breakdown of life and non life turnover per class of business
in thousands USD| 2011 | 2012 | 2012 shares | |
|---|---|---|---|
| Non life | |||
Motor 1 | 46 418 | 49 992 | 26.7% |
Fire | 22 274 | 23 897 | 12.8% |
Marine 2 | 21 932 | 22 807 | 12.2% |
Health | 32 053 | 27 712 | 14.8% |
Personal accident | 1 920 | 1 342 | 0.7% |
Engineering 3 | 19 472 | 17 662 | 9.5% |
Total non life | 144 069 | 143 412 | 76.7% |
| Life | |||
Individual insurance | 12 685 | 14 388 | 7.7% |
Group life insurance | 32 449 | 29 109 | 15.6% |
Total life | 45 134 | 43 497 | 23.3% |
Total | 189 203 | 186 909 | 100% |
2 including aviation
3 including other risks
Breakdown of premiums per class of business in 2012
Exchange rate FCFA/USD as at 31/12 | 2011 | 2012 |
0.002011 | 0.002019 |