Tanzania's insurance industry in 2018: ranking of companies and turnover per class of business

Tanzania's insurance market features
- Regulatory authority:Tanzania Insurance Regulatory Authority
- Life and non life premiums (2018): 297.5 millions USD
- Insurance density (2018): 5.28 USD
- Penetration rate (2018): 0.52%
Tanzania's insurance market structure in 2018
| Market players | Total |
|---|---|
Insurance companies | 30 |
Reinsurance company | 1 |
Insurance agents | 635 |
Insurance brokers | 109 |
Loss adjusters | 55 |
Actuaries | 17 |
Total | 830 |
Identity
- Area (1): 945 088 Km2
- Population (1) (2018) : 56 318 000 inhabitants
- GDP (1) (2018) : 58.001 billion USD
- GDP per capita (2018) : 1050.7 USD
- Inflation rate (1) (2018) : 5.4%
- Taux d'inflation (1) (2018) : 3.5%
- Main economic sectors : agriculture (cotton, tea, cloves.... ), mining industry (gold, diamond.…), natural gas and tourism.
Main cities (1)
(per number of inhabitants in 2016)
- Dar es Salam : 5 572 776
- Zanzibar : 796 903
- Mwanza : 830 342
- Dodoma (Capital) : 571 629
(1) Source: World Bank
(2) Source: Bopulation.data
Tanzania's insurance market: Evolution of premiums per life and non-life insurance (2014-2018)
Figures in thousands of USD
| 2014 | 2015 | 2016 | 2017 | 2018 | |
|---|---|---|---|---|---|
| Non-life | 276 629.36 | 247 575.60 | 263 609.10 | 244 771.12 | 252 681.33 |
| Life | 33 829.60 | 30 910.95 | 33 412.05 | 35 570.92 | 44 836.96 |
| Total | 310 458.96 | 278 486.55 | 297 021.15 | 280 342.04 | 297 518.29 |
Tanzania's insurance market: Turnover per company (2017-2018)
Figures in thousands
| Company | 2018 turnover | 2017 turnover | 2017-2018 evolution (1) | 2018 | ||
|---|---|---|---|---|---|---|
| In TZS | In USD | In TZS | In USD | market share | ||
Jubilee | 90 681 000 | 38 992.83 | 80 870 000 | 35 582.80 | 12.10% | 13.10% |
Alliance | 63 032 000 | 27 103.76 | 57 185 000 | 25 161.40 | 10.20% | 9.10% |
NIC | 45 124 000 | 19 403.32 | 43 513 000 | 19 145.72 | 3.70% | 6.50% |
AAR | 43 522 000 | 18 714.46 | 46 149 000 | 20 305.56 | -5.70% | 6.30% |
Heritage | 43 041 000 | 18 507.63 | 35 780 000 | 15 743.20 | 20.30% | 6.20% |
Strategis | 42 554 000 | 18 298.22 | 38 992 000 | 17 156.48 | 9.10% | 6.20% |
Phoenix | 25 739 000 | 11 067.77 | 21 508 000 | 9 463.52 | 19.70% | 3.70% |
Britam | 24 105 000 | 10 365.15 | 22 548 000 | 9 921.12 | 6.90% | 3.50% |
UAP | 21 741 000 | 9 348.63 | 27 930 000 | 12 289.20 | -22.20% | 3.10% |
ZIC | 21 188 000 | 9 110.84 | 19 778 000 | 8 702.32 | 7.10% | 3.10% |
Reliance | 19 914 000 | 8 563.02 | 18 920 000 | 8 324.80 | 5.30% | 2.90% |
Mayfair | 19 434 000 | 8 356.62 | 14 303 000 | 6 293.32 | 35.90% | 2.80% |
Sanlam General | 17 910 000 | 7 701.30 | 20 213 000 | 8 893.72 | -11.40% | 2.60% |
Bumaco | 14 025 000 | 6 030.75 | 11 359 000 | 4 997.96 | 23.50% | 2.00% |
Resolution | 13 411 000 | 5 766.73 | 13 079 000 | 5 754.76 | 2.50% | 1.90% |
Metropolitan | 13 263 000 | 5 703.09 | 7 817 000 | 3 439.48 | 69.70% | 1.90% |
Tanzindia | 12 651 000 | 5 439.93 | 14 307 000 | 6 295.08 | -11.60% | 1.80% |
Maxinsure | 10 605 000 | 4 560.15 | 12 089 000 | 5 319.16 | -12.30% | 1.50% |
IGT | 10 280 000 | 4 420.40 | 12 439 000 | 5 473.16 | -17.40% | 1.50% |
MO | 7 978 000 | 3 430.54 | 5 962 000 | 2 623.28 | 33.80% | 1.20% |
ICEA Lion | 7 408 000 | 3 185.44 | 7 521 000 | 3 309.24 | -1.50% | 1.10% |
Mgen | 5 863 000 | 2 521.09 | 9 063 000 | 3 987.72 | -35.30% | 0.90% |
GA | 5 296 000 | 2 277.28 | 6 036 000 | 2 655.84 | -12.30% | 0.80% |
First | 5 080 000 | 2 184.40 | 4 356 000 | 1 916.64 | 16.60% | 0.70% |
Milembe | 2 277 000 | 979.11 | 2 388 000 | 1 050.72 | -4.60% | 0.30% |
Star General | 1 509 000 | 648.87 | 2 193 000 | 964.92 | -31.20% | 0.20% |
| Total non life | 587 631 000 | 252 681.33 | 556 298 000 | 244 771.12 | 5.60% | 84.90% |
Sanlam Life | 70 802 000 | 30 444.86 | 48 413 000 | 21 301.72 | 46.20% | 10.20% |
Alliance Life | 12 176 000 | 5 235.68 | 9 715 000 | 4 274.60 | 25.30% | 1.80% |
NIC | 11 276 000 | 4 848.68 | 15 505 000 | 6 822.20 | -27.30% | 1.60% |
Jubilee Life | 7 434 000 | 3 196.62 | 6 194 000 | 2 725.36 | 20.00% | 1.10% |
Metropolitan Life | 2 584 000 | 1 111.12 | 1 016 000 | 447.04 | 154.30% | 0.40% |
| Total life | 104 272 000 | 44 836.96 | 80 843 000 | 35 570.92 | 29.00% | 15.10% |
| Grand total | 691 903 000 | 297 518.29 | 637 141 000 | 280 342.04 | 8.60% | 100% |
(1) Growth rate in local currency
Tanzania's insurance market: Turnover 2018 per class of business and per non life insurance company
Figures in thousands of USD| Company | Motor | Health | Fire | Accident | Marine (1) | Other risks (2) | Total non life |
|---|---|---|---|---|---|---|---|
Jubilee | 10 182.83 | 13 196.27 | 8 800.38 | 4 105.21 | 1 736.77 | 971.37 | 38 992.83 |
Alliance | 12 832.92 | 716.81 | 4 175.30 | 155.66 | 2 282.01 | 6 941.06 | 27 103.76 |
NIC | 7 023.19 | - | 3 994.70 | 886.66 | 3 964.60 | 3 534.17 | 19 403.32 |
AAR | - | 18 700.70 | - | - | - | 13.76 | 18 714.46 |
Heritage | 2 703.41 | 716.81 | 8 590.54 | 3 716.49 | 1 102.52 | 1 677.86 | 18 507.63 |
Strategis | 180.17 | 17 610.65 | 350.45 | 43.86 | 6.02 | 107.07 | 18 298.22 |
Phoenix | 4 288.39 | - | 3 552.23 | 976.10 | 2 033.47 | 217.58 | 11 067.77 |
Britam | 4 778.59 | 43.43 | 2 493.57 | 1 825.35 | 341.85 | 882.36 | 10 365.15 |
UAP | 5 201.28 | - | 1 673.56 | 120.40 | 263.59 | 2 089.80 | 9 348.63 |
ZIC | 7 993.27 | - | 453.65 | 129.43 | 534.49 | - | 9 110.84 |
Reliance | 3 299.39 | - | 2 532.70 | 88.58 | 778.30 | 1 864.05 | 8 563.02 |
Mayfair | 3 628.34 | - | 2 436.81 | 114.38 | 693.59 | 1 483.50 | 8 356.62 |
Sanlam General | 2 673.74 | - | 1 673.56 | 3 166.95 | 25.80 | 161.25 | 7 701.30 |
Bumaco | 5 670.84 | - | 152.22 | 2.58 | - | 205.11 | 6 030.75 |
Resolution | 1 782.35 | 3 515.68 | 207.26 | 54.18 | 27.09 | 180.17 | 5 766.73 |
Metropolitan | 2 002.94 | - | 870.75 | 1 532.52 | 408.93 | 887.95 | 5 703.09 |
Tanzindia | 1 434.05 | - | 1 968.97 | 86.00 | 802.81 | 1 148.10 | 5 439.93 |
Maxinsure | 2 065.72 | 285.09 | 831.62 | 319.06 | 584.37 | 474.29 | 4 560.15 |
IGT | 3 873.87 | - | 323.36 | 127.71 | -5.16 | 100.62 | 4 420.40 |
MO | 725.84 | - | 1 280.54 | 859.57 | 351.31 | 213.28 | 3 430.54 |
ICEA Lion | 1 035.87 | - | 595.55 | 512.13 | 248.54 | 793.35 | 3 185.44 |
Mgen | 1 622.82 | - | 678.54 | 101.48 | 53.32 | 64.93 | 2 521.09 |
GA | 504.39 | 190.06 | 668.22 | 338.84 | 203.39 | 372.38 | 2 277.28 |
First | 703.48 | - | 553.41 | 82.56 | 207.69 | 637.26 | 2 184.40 |
Milembe | 724.12 | - | 117.82 | 12.47 | - | 124.70 | 979.11 |
Star General | 423.12 | - | 85 .40 | - | - | 140.61 | 648.87 |
| Total non life | 87 354.93 | 54 975.50 | 49 060.85 | 19 358.17 | 16 645.30 | 25 286.58 | 252 681.33 |
(1) including maritime transport and aviation
(2) including engineering, energy and miscellaneous accident
Tanzania's insurance market: Turnover 2018 per class of business and per life insurance company
Figures in thousands of USD
| Company | Individual life insurance | Group life insurance | Others | Total life |
|---|---|---|---|---|
Sanlam Life | 3 659.73 | 26 696.12 | 89.01 | 30 444.86 |
Alliance Life | 171.57 | 5 064.11 | - | 5 235.68 |
NIC | 3 709.18 | 1 074.57 | 64.93 | 4 848.68 |
Jubilee Life | 715.52 | 2 481.10 | - | 3 196.62 |
Metropolitan Life | 707.35 | 403.77 | - | 1 111.12 |
| Total life | 8 963.35 | 35 719.67 | 153.94 | 44 836.96 |
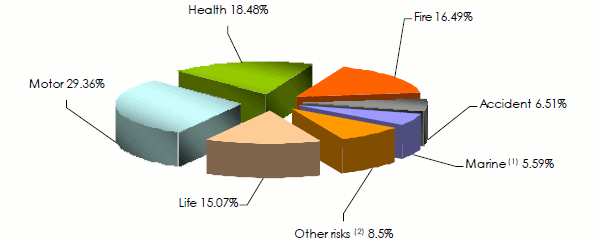
Tanzania's insurance market: Turnover per class of business (2014-2018)
Figures in thousands of USD
| Class of business | 2014 | 2015 | 2016 | 2017 | 2018 | 2018 shares |
|---|---|---|---|---|---|---|
Motor | 103 807.20 | 92 861.55 | 90 398.25 | 83 555.56 | 87 354.93 | 29.36% |
Health | 51 484.16 | 46 447.20 | 53 728.20 | 57 335.08 | 54 975.50 | 18.48% |
Fire | 48 006.00 | 47 494.35 | 49 898.25 | 46 888.60 | 49 060.85 | 16.49% |
Accident | 27 877.92 | 27 045.00 | 24 701.85 | 18 852.68 | 19 358.17 | 6.51% |
Marine (1) | 18 617.20 | 14 170.95 | 16 814.25 | 14 064.60 | 16 645.30 | 5.59% |
Other risks (2) | 26 836.88 | 19 556.55 | 28 068.30 | 24 074.60 | 25 286.58 | 8.50% |
| Total non life | 276 629.36 | 247 575.60 | 263 609.10 | 244 771.12 | 252 681.33 | 84.93% |
Life | 33 829.60 | 30 910.95 | 33 412.05 | 35 570.92 | 44 836.96 | 15.07% |
| Grand total | 310 458.96 | 278 486.55 | 297 021.15 | 280 342.04 | 297 518.29 | 100% |
(1) including maritime transport and aviation
(2) including engineering, energy and miscellaneous accident
Tanzania's insurance market: Net loss ratio 2018 per class of business
Figures in thousands
| Class of business | Net incurred losses | Net earned premiums | Net loss ratio | ||
|---|---|---|---|---|---|
| In TZS | In USD | In TZS | In USD | ||
Motor | 72 324 000 | 31 099.32 | 157 267 000 | 67 624.81 | 45.99% |
Health | 66 607 000 | 28 641.01 | 77 947 000 | 33 517.21 | 85.45% |
Fire | 5 437 000 | 2 337.91 | 27 370 000 | 11 769.10 | 19.86% |
Accident | 5 871 000 | 2 524.53 | 15 822 000 | 6 803.46 | 37.11% |
Marine (1) | 3 289 000 | 1 414.27 | 7 864 000 | 3 381.52 | 41.82% |
Other risks (2) | 4 028 000 | 1 732.04 | 14 213 000 | 6 111.59 | 28.34% |
| Total non life | 157 556 000 | 67 749.08 | 300 483 000 | 129 207.69 | 52.43% |
(1) including maritime transport and aviation
(2) including engineering, energy and miscellaneous accident
Tanzania's insurance market: Management expenses ratio 2018 per class of business
Figures in thousands
| Class of business | Net management expenses | Net written premiums | Net management expenses ratio | ||
|---|---|---|---|---|---|
| In TZS | In USD | In TZS | In USD | ||
Motor | 88 938 000 | 38 243.34 | 176 715 000 | 75 987.45 | 50.33% |
Health | 27 184 000 | 11 689.12 | 77 889 000 | 33 492.27 | 34.90% |
Fire | 20 741 000 | 8 918.63 | 23 183 000 | 9 968.69 | 89.47% |
Accident | 11 896 000 | 5 115.28 | 16 493 000 | 7 091.99 | 72.13% |
Marine (1) | 8 734 000 | 3 755.62 | 9 234 000 | 3 970.62 | 94.59% |
Other risks (2) | 10 742 000 | 4 619.06 | 14 543 000 | 6 253.49 | 73.86% |
| Total non life | 168 235 000 | 72 341.05 | 318 057 000 | 136 764.51 | 52.89% |
(1) including maritime transport and aviation
(2) including engineering, energy and miscellaneous accident
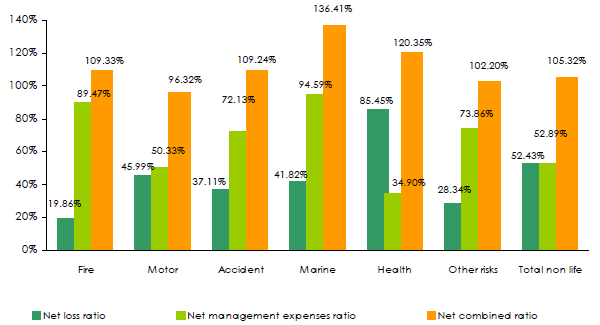
Tanzania's insurance market: Combined ratio 2018 per class of business
| Net loss ratio | Net management expenses ratio | Net combined ratio | |
|---|---|---|---|
Motor | 45.99% | 50.33% | 96.32% |
Health | 85.45% | 34.90% | 120.35% |
Fire | 19.86% | 89.47% | 109.33% |
Accident | 37.11% | 72.13% | 109.24% |
Marine (1) | 41.82% | 94.59% | 136.41% |
Other risks (2) | 28.34% | 73.86% | 102.20% |
| Total non life | 52.43% | 52.89% | 105.32% |
(1) including maritime transport and aviation
(2) including engineering, energy and miscellaneous accident
Exchange rate TZS/USD as at 31/12 | 2014 | 2015 | 2016 | 2017 | 2018 |
0.00056 | 0.00045 | 0.00045 | 0.00044 | 0.00043 |
Read also : Insurance industry in Africa