The Algerian insurance market

Insurance market features
- Regulatory authority: Ministry of Finance General Management of Treasury / Insurance Management
- Written premiums (2003):
445 millions USD - Insurance density (2003): 13.8 USD
- Penetration rate (2003): 0.67%
Market structure
(as at 30-06-2004)
| Company type | Number | |
|---|---|---|
State companie | Reinsurance | 1 |
Insurance | 3 | |
Specialized insurance | 4 | |
Specialized mutuals | 2 | |
Private companies | 6 | |
Total | 16 | |
Identity
- Area: 2 381 740 Km2
- Population (2003): 32 277 942 inhabitants
- GDP (2003): 66 billion USD
- GDP per capita (2003):
2 045 USD - GDP growth rate (2003): 6.8 %
- Inflation rate (2003): 2.6 %
- Main economic sectors: hydrocarbon industry (petroleum and natural gas), mining industries, agriculture, services.
Major towns
(in number of inhabitants)
- Algiers (capital): 3 700 000
- Oran: 1 600 000
- Constantina: 1 000 000
- Annaba: 850 000
Turnover evolution
in thousands USD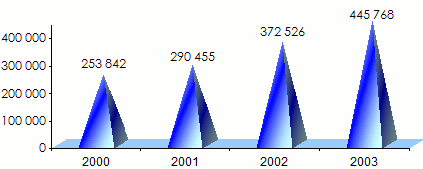
Premiums split by company 2000-2003
in thousands USD| 2000 | 2001 | 2002 | 2003 | |||||
|---|---|---|---|---|---|---|---|---|
| Companies | Amount | Share | Amount | Share | Amount | Share | Amount | Share |
SAA | 88 702 | 34.94% | 90 044 | 31% | 94 033 | 25.24% | 120 778 | 27.09% |
CAAR | 55 013 | 21.67% | 60 975 | 21% | 89 712 | 24.08% | 73 218 | 16.42% |
CAAT | 52 683 | 20.75% | 54 271 | 18.68% | 68 423 | 18.37% | 97 091 | 21.78% |
CAGEX | 118 | 0.05% | 208 | 0.07% | 131 | 0.04% | 203 | 0.05% |
SCGI | 165 | 0.07% | 287 | 0.1% | 573 | 0.15% | 1 456 | 0.33% |
AGCI | - | - | - | - | 7 | 0% | 163 | 0.04% |
CASH | 6 426 | 2.53% | 16 244 | 5.59% | 24 993 | 6.71% | 26 017 | 5.84% |
CNMA | 30 310 | 11.94% | 37 858 | 13% | 34 432 | 9.24% | 36 860 | 8.27% |
MAATEC | 214 | 0.08% | 219 | 0.08% | 249 | 0.07% | 278 | 0.06% |
TRUST ALGERIA | 10 691 | 4.21% | 12 484 | 4.3% | 27 955 | 7.50% | 32 827 | 7.36% |
2A | 4 492 | 1.77% | 8 889 | 3.06% | 12 984 | 3.49% | 15 518 | 3.48% |
CIAR | 4 960 | 1.95% | 7 750 | 2.67% | 10 464 | 2.81% | 19 584 | 4.39% |
AL BARAKA | 68 | 0.03% | 1 226 | 0.4% | 2 750 | 0.74% | 5 448 | 1.22% |
STAR HANA | - | - | - | - | 929 | 0.25% | - | - |
AL RAYAN | - | - | - | - | 2 169 | 0.58% | 5 996 | 1.35% |
GAM | - | - | - | - | 2 722 | 0.73% | 10 331 | 2.32% |
TOTAL | 253 842 | 100% | 290 455 | 100% | 372 526 | 100% | 445 768 | 100% |
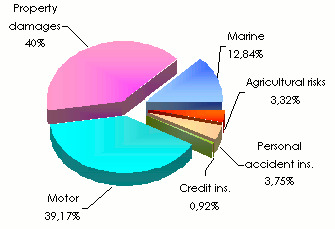
Premiums split by class of business 2000-2003
in thousands USD| 2000 | 2001 | 2002 | 2003 | |||||
|---|---|---|---|---|---|---|---|---|
| Classes | Amount | Share | Amount | Share | Amount | Share | Amount | Share |
Motor | 106 321 | 41.88% | 117 906 | 40.59% | 131 865 | 35.40% | 174 615 | 39.17% |
Property | 81 595 | 32.14% | 92 800 | 31.95% | 154 859 | 41.57% | 178 265 | 40% |
Marine | 38 285 | 15.08% | 45 561 | 15.69% | 50 550 | 13.57% | 57 257 | 12.84% |
Agricultural risks | 12 433 | 4.9% | 19 242 | 6.62% | 15 626 | 4.19% | 14 792 | 3.32% |
Personal accident | 14 154 | 5.58% | 13 293 | 4.58% | 14 739 | 3.96% | 16 734 | 3.75% |
Credit ins. | 1 054 | 0.42% | 1 653 | 0.57% | 4 887 | 1.31% | 4 105 | 0.92% |
Total | 253 842 | 100% | 290 455 | 100% | 372 526 | 100% | 445 768 | 100% |
Major companies' turnover evolution 2000-2003
in thousands USD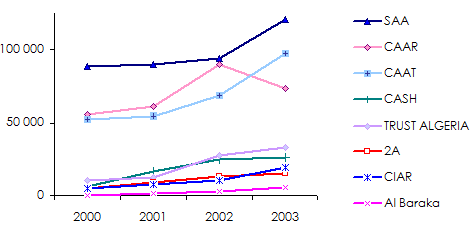
Loss experience of major companies 2000-2002
in thousands USD| 2000 | 2001 | 2002 | ||||
|---|---|---|---|---|---|---|
| Companies | Claims1 | Loss ratio2 | Claims | Loss ratio | Claims | Loss ratio |
SAA | 68 495 | 79.8% | 77 441 | 89.0% | 77 286 | 86.1% |
CAAR | 63 551 | 115.8% | 60 574 | 95.5% | 34 972 | 41.4% |
CAAT | 29 389 | 57.1% | 26 083 | 50.5% | 39 666 | 59.2% |
CASH | - | - | 5 654 | 52.7% | 1 219 | 5.1% |
CNMA | 19 362 | 67.2% | 18 936 | 53.6% | 17 306 | 49.3% |
TRUST ALGERIA | 6 634 | 72.8% | 5 241 | 49.5% | 6 101 | 21.6% |
2A | 1 437 | 43.2% | 4 083 | 49.4% | 5 816 | 49.4% |
CIAR | 2 223 | 57.1% | 5 047 | 78.6% | 5 965 | 60.8% |
AL BARAKA | - | - | 330 | 36.5% | 1 055 | 47.7% |
AL RAYAN | - | - | - | - | 641 | 41.8% |
GAM | - | - | - | - | 789 | 42.5% |
TOTAL | 191 091 | 80.5% | 203 389 | 74.1% | 190 816 | 53.5% |
2002 companies' productivity
in USD| Companies | Staff 2002 | Premium1/employee |
|---|---|---|
SAA | 3 665 | 25 657 |
CAAR | 1 616 | 55 514 |
CAAT | 1 477 | 46 325 |
CAGEX | - | - |
SCGI | 23 | 24 913 |
AGCI | 20 | 350 |
CASH | 52 | 480 634 |
CNMA | 1103 | 31 216 |
MAATEC | 22 | 11 318 |
TRUST ALGERIA | 115 | 243 086 |
2A | 310 | 41 883 |
CIAR | 182 | 57 494 |
AL BARAKA | - | - |
STAR HANA | - | - |
AL RAYAN | 80 | 27 112 |
GAM | 339 | 8 029 |
TOTAL | 9 004 | 41 3732 |
Exchange rate USD/DZD as at 31/12 | 2000 | 2001 | 2002 | 2003 |
76.873 | 75.211 | 77.868 | 70.285 |