The Burkinabe insurance market

Insurance market features
- Regulatory authority: Ministry of Finances and Economy
- Premiums (2003): 27 844 787 USD
- Insurance density (2003): 2.34 USD
- Penetration rate (2003): 0.7%
Market structure 2004
Actors | Number |
|---|---|
Non life insurance companies | 5 |
Life insurance companies | 3 |
Brokers | 7 |
General agents | 37 |
Identity
- Area: 274 120 Km2
- Population (2003): 11 900 000 inhabitants
- GDP (2003): 4.2 billion USD
- GDP per capita (2003): 353 USD
- GDP growth rate (2003): 6.5%
- Inflation rate (2003): 2 %
- Main economic sectors: Agriculture (peanut, cotton and cane sugar), gold and cattle breeding
Major towns
(in number of inhabitants)
- Ouagadougou (capital): 2 000 000
- Bobo Dioulasso: 500 000
- Koudougou: 160 000
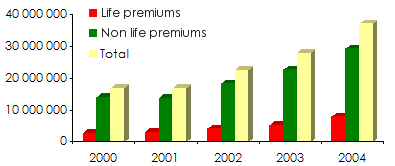
Turnover evolution: 2000-2004
in USD| 2000 | 2001 | 2002 | 2003 | 2004 | |
|---|---|---|---|---|---|
Non life premiums | 14 114 980 | 13 778 943 | 18 299 404 | 22 631 816 | 29 221 570 |
Life premiums | 2 679 405 | 3 082 035 | 4 187 018 | 5 212 971 | 7 890 735 |
Total | 16 794 385 | 16 860 978 | 22 486 422 | 27 844 787 | 37 112 305 |
Written premiums split by class of business: 2000-2004
in USD| 2000 | 2001 | 2002 | 2003 | 2004 | |
|---|---|---|---|---|---|
| Non life | |||||
Motor | 8 763 240 | 8 085 745 | 10 303 186 | 12 526 160 | 16 633 461 |
Accident-health | 787 357 | 1 132 243 | 1 440 005 | 1 807 061 | 2 936 273 |
Fire | 1 833 673 | 1 873 125 | 2 588 370 | 3 162 450 | 3 678 179 |
General TPL | 363 138 | 353 072 | 620 199 | 873 515 | 962 093 |
Miscellaneous | 360 565 | 383 179 | 429 360 | 606 232 | 876 409 |
Marine | 1 908 670 | 1 867 571 | 2 814 661 | 3 387 388 | 4 135 155 |
Acceptances | 98 337 | 84 008 | 103 623 | 269 010 | 0 |
Non life total | 14 114 980 | 13 778 943 | 18 299 404 | 22 631 816 | 29 221 570 |
| Life | |||||
Life | 2 679 405 | 3 082 035 | 4 187 018 | 5 212 971 | 7 890 735 |
Grand total | 16 794 385 | 16 860 978 | 22 486 422 | 27 844 787 | 37 112 305 |
Life and non life premiums in 2004 | Written premiums split by class of business in 2004 | |
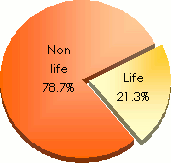 | 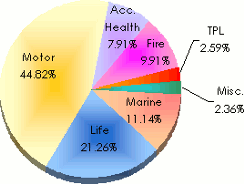 |
Written premiums' evolution by class of business:
2000-2004
in USD 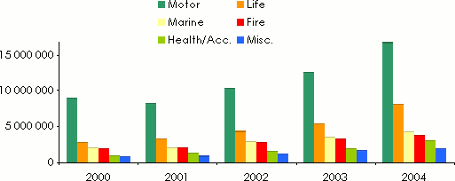
Written premiums split by company: 2000-2004
in USD| 2000 | 2001 | 2002 | 2003 | 2004 | |
|---|---|---|---|---|---|
| Non life companies | |||||
SONAR | 6 428 716 | 6 240 739 | 7 774 833 | 9 499 689 | 11 074 167 |
AGF | 4 426 723 | 4 235 300 | 5 482 041 | 6 128 554 | 7 395 728 |
UAB | 1 419 693 | 1 397 604 | 1 989 724 | 2 796 772 | 4 390 201 |
Générale des Assurances | 1 496 304 | 1 232 699 | 1 604 103 | 1 919 597 | 3 135 576 |
COLINA | 343 544 | 672 601 | 1 448 703 | 2 287 204 | 3 225 898 |
Total non life | 14 114 980 | 13 778 943 | 18 299 404 | 22 631 816 | 29 221 570 |
| Life companies | |||||
SONAR | 1 020 144 | 1 104 353 | 1 620 746 | 2 100 607 | 2 901 313 |
AGF | 741 670 | 942 297 | 1 279 296 | 1 592 195 | 2 496 331 |
UAB | 917 591 | 1 035 385 | 1 286 976 | 1 520 169 | 2 493 091 |
Total life | 2 679 405 | 3 082 035 | 4 187 018 | 5 212 971 | 7 890 735 |
Grand total | 16 794 385 | 16 860 978 | 22 486 422 | 27 844 787 | 37 112 305 |
2004 breakdown of premiums split by company
| Non life premiums | Life premiums | |
|---|---|---|
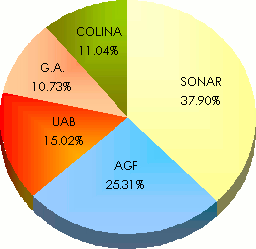 | 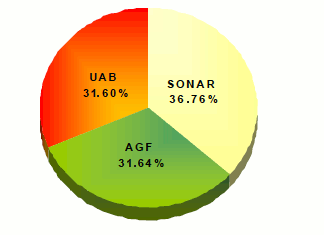 |
Loss history of non life companies
in USD| Incurred claims | Loss ratio | |||
|---|---|---|---|---|
| 2002 | 2003 | 2002 | 2003 | |
AGF | 936 000 | 1 861 000 | 17.1% | 30.4% |
COLINA | 335 000 | 646 000 | 23.1% | 28.3% |
Générale des Assurances | 580 000 | 842 000 | 36.2% | 43.8% |
SONAR | 2 718 000 | 2 771 000 | 35.0% | 29.2% |
UAB | 727 000 | 1 028 000 | 36.5% | 36.8% |
Exchange rate USD/XOF as at 31/12 | 2000 | 2001 | 2002 | 2003 | 2004 |
708.03 | 743.922 | 625.497 | 576.766 | 481.330 |