The Cameroonian insurance market

Insurance market features
- Regulatory authority: Ministry of Finance and Budget Insurance Division
- Written premiums (2003): 145 million USD
- Insurance density (2003): 9.06 USD
- Penetration rate (2003): 1.18%
Identity
- Area: 475 440 Km2
- Population (2003): 16 100 000 inhabitants
- GDP (2003): 12.4 billion USD
- GDP per capita (2003): 770 USD
- GDP growth rate (2003): 4.2 %
- Inflation rate (2003): 1.2 %
- Main economic sectors: hydrocarbon industry (petroleum), food industry, agriculture (coffee, cacao, cotton…), services
Major towns
(in number of inhabitants)
- Douala: 2 000 000
- Yaoundé (capital): 1 200 000
- Nkongsamba: 800 000
- Garoua: 400 000
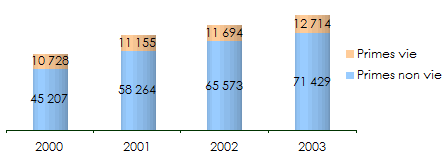
Turnover evolution 2000-2003
in USDYears | 2000 | 2001 | 2002 | 2003 |
|---|---|---|---|---|
Non Life premiums | 63 848 827 | 78 319 871 | 104 832 780 | 123 844 736 |
Life premiums | 15 152 087 | 14 995 517 | 18 695 980 | 22 043 031 |
Total | 79 000 914 | 93 315 388 | 123 528 760 | 145 887 767 |
Non Life premium split by company 2000-2003
in USD| Companies | 2000 | 2001 | 2002 | 2003 |
|---|---|---|---|---|
CHANAS | 10 188 315 | 13 455 234 | 22 536 934 | 25 715 835 |
AXA | 14 041 978 | 13 845 873 | 19 385 051 | 19 526 198 |
SAAR | 8 597 071 | 9 959 949 | 13 842 913 | 17 504 717 |
SNAC | 10 578 847 | 13 276 629 | 14 555 639 | 15 225 615 |
ACTIVA | 5 605 739 | 7 080 006 | 10 858 832 | 12 055 608 |
PRO ASSUR | - | 1 642 075 | 3 494 536 | 7 913 220 |
CITOYENNE | 6 357 354 | 4 955 274 | 6 186 391 | 7 373 162 |
SATELLITE | 2 929 685 | 3 603 472 | 4 548 303 | 5 174 369 |
GMA | 2 066 619 | 5 091 193 | 3 147 302 | 5 704 427 |
CAMINSUR | 1 892 769 | 2 508 910 | 2 777 956 | 2 869 588 |
CPA | 1 590 450 | 1 651 118 | 2 286 679 | 2 799 322 |
BENEFICIAL | - | 1 250 138 | 920 420 | 1 150 115 |
AGC | - | - | 291 824 | 832 560 |
Total non life | 63 848 827 | 78 319 871 | 104 832 780 | 123 844 736 |
Non Life premium split by class of business 2000-2003
in USD| Classes of business | 2000 | 2001 | 2002 | 2003 |
|---|---|---|---|---|
Health & personal accident | 13 536 048 | 17 668 318 | 21 331 084 | 26 893 074 |
Motor | 25 021 582 | 28 827 778 | 32 872 528 | 40 272 165 |
Fire | 8 186 322 | 8 757 876 | 11 635 077 | 13 026 907 |
General third party liability | 2 353 403 | 2 403 442 | 3 787 327 | 3 431 377 |
Marine | 10 757 941 | 15 521 278 | 28 308 114 | 24 076 503 |
Miscellaneous | 4 018 754 | 5 115 752 | 6 809 734 | 15 670 502 |
Reinsurance acceptances | -25 223 | 25 427 | 88 916 | 474 208 |
Total non life | 63 848 827 | 78 319 871 | 104 832 780 | 123 844 736 |
Non Life premium evolution 2000-2003
in millions XAF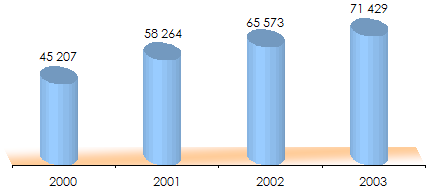
Life premium split by company 2000-2003
in USD| Companies | 2000 | 2001 | 2002 | 2003 |
|---|---|---|---|---|
SNAC VIE | 5 119 259 | 5 490 363 | 7 514 733 | 8 775 945 |
BENEFICIAL | 6 230 224 | 6 312 239 | 7 053 357 | 7 663 452 |
AXA VIE | 2 479 030 | 1 852 749 | 2 496 176 | 3 026 809 |
ALL LIFE | 785 037 | 743 810 | 1 131 973 | 1 279 901 |
CITOYENNE | 60 503 | 48 890 | 39 540 | 671 350 |
ASSURAMA | 245 567 | 390 224 | 331 583 | 511 836 |
SATELLITE | 232 467 | 157 242 | 128 618 | 113 738 |
Total | 15 152 087 | 14 995 517 | 18 695 980 | 22 043 031 |
Life premium evolution 2000-2003
in millions XAF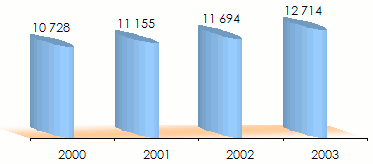
Loss ratios by class of business 2003
in USD| Classes of business | Earned premiums | Claims | Loss ratio |
|---|---|---|---|
Health & personal accident | 22 555 589 | 12 531 588 | 55.6% |
Motor | 39 053 741 | 22 623 262 | 57.9% |
Fire | 12 987 758 | 3 857 686 | 29.7% |
General third party liability | 3 715 189 | -32 414 | -0.9% |
Marine | 22 055 330 | 1 466 588 | 6.6% |
Miscellaneous | 14 711 401 | 3 459 001 | 23.5% |
Reinsurance acceptances | 474 208 | 1 096 465 | 231.2% |
Total | 115 553 216 | 45 002 176 | 38.9% |
Exchange rate USD/XAF as at 31/12 | 2000 | 2001 | 2002 | 2003 |
708.039 | 743.922 | 625.497 | 576.766 |