The Egyptian insurance market

Insurance market features
- Regulatory authority: Egypt Insurance Supervisory Authority
- Premiums (2006): 836 millions USD
- Insurance density (2006): 10.88 USD
- Penetration rate (2006): 0.81%
Market structure in 2006
- Life companies: 5
- Non life companies: 9
- Composite companies: 6
- Reinsurance company: 1
Identity
- Area: 1 001 450 Km2
- Population (2006): 76 800 000 inhabitants
- GDP (2006): 103.5 billion USD
- GDP per capita (2006): 1348 USD
- GDP growth rate (2006): 5.96%
- Inflation rate (2006): 4.3%
- Main economic sectors: tourism, textile industry, agriculture (cotton, rice), gas, oil
Major cities
(in number of inhabitants)
- Cairo (capital): 16 millions
- Alexandria: 4.5 millions
- Suez: 584 000
- Port Said: 548 000
Non life premiums split by class of business1: 2002-2006
in thousands USD| Classes of business | 2002 | 2003 | 2004 | 2005 | 2006 |
|---|---|---|---|---|---|
Fire | 57 001 | 52 144 | 50 169 | 60 002 | 66 373 |
Marine | 76 648 | 74 788 | 111 272 | 143 675 | 99 586 |
Motor | 100 822 | 79 967 | 86 981 | 100 881 | 114 124 |
Health | 8 338 | 6 857 | 7 709 | 11 819 | 23 712 |
Engineering | 25 415 | 26 369 | 58 694 | 48 164 | 51 739 |
Other risks2 | 27 588 | 76 909 | 90 304 | 119 692 | 137 863 |
Total | 295 812 | 317 034 | 405 129 | 484 233 | 493 397 |
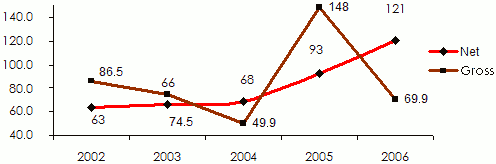
Loss ratios1: 2002-2006
| Classes of business | 2002 | 2003 | 2004 | 2005 | 2006 |
|---|---|---|---|---|---|
Fire | 24.1 | 27.2 | 46.3 | 123.6 | (27.8) |
Marine cargo | 42.8 | 101.2 | 27 | 46 | (1.9) |
Inland transport | 6.8 | 2.8 | 16.4 | 98.1 | 116.9 |
Marine hull | 100.7 | 146.5 | 83.6 | 48.1 | 83.9 |
Aviation | 338.5 | 62.2 | 41.1 | (5.3) | (6.1) |
Motor comprehensive | 61.9 | 59.9 | 69.1 | 63.5 | 68.2 |
Motor act | 193.9 | 253.6 | 291.6 | 412.9 | 723.8 |
Engineering | 26.8 | 128.1 | 13.1 | 41.2 | 52.8 |
Oil | 34.7 | 46.4 | 1.1 | 719.5 | 65.7 |
Accident | 29.5 | 27.3 | 7.7 | 27.5 | 16.4 |
Health | 98.3 | 90.6 | 106.5 | 103.5 | 93.9 |
Total | 86.5 | 74.5 | 49.9 | 148.8 | 69.9 |
Non life results breakdown: 2002-2006
in thousands USD| Classes of business | 2002 | 2003 | 2004 | 2005 | 2006 |
|---|---|---|---|---|---|
Fire | 25 765 | 16 882 | 14 524 | 29 503 | 24 320 |
Marine | 31 241 | 27 594 | 38 689 | 56 534 | 62 213 |
Motor | 7 997 | (8 987) | (23 122) | (22 598) | (96 780) |
Health | 1 205 | (520) | (1 549) | (1 593) | (3 218) |
Engineering | 8 522 | 7 752 | 6 802 | 15 467 | 10 810 |
Other risks1 | 18 566 | 14 232 | 27 321 | 14 017 | 50 164 |
Total | 93 296 | 56 953 | 62 665 | 91 330 | 47 509 |
Exchange rate EGD/USD as at 31/12 | 2002 | 2003 | 2004 | 2005 | 2006 |
0.217 | 0.163 | 0.165 | 0.175 | 0.176 |
Source: The annual report of the Egypt Insurance Supervisory Authority (EISA)