The Egyptian insurance market

Insurance market features
- Regulatory authority: Egypt Insurance Supervisory Authority
- Life and non life Premiums (2009): 1 434 million USD
- Insurance density (2009): 17.28 USD
- Penetration rate (2009): 0.76%
Market structure in 2009
Actors | Number |
|---|---|
Insurance companies | 22 |
Non life companies | 17 |
Life companies | 5 |
Reinsurance company | 1 |
Identity
- Area: 1 001 450 Km2
- Population (2009): 82 999 393 inhabitants
- GDP (2009): 188.4 billion USD
- GDP per capita (2009): 2 270 USD
- GDP growth rate (2009): 4.7%
- Inflation rate (2009): 16.2%
- Main economic activities: tourism, textile industry, agriculture (cotton, rice), gas, oil
Major cities
(in number of inhabitants)
- Cairo (capital): 16 244 674
- Alexandria: 4 541 100
- Suez: 633 514
- Al Mansourah: 611 247
- Port Said: 588 935
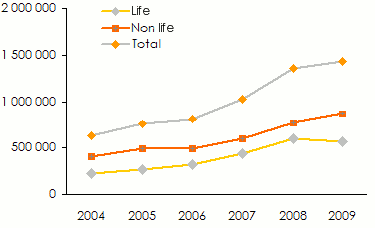
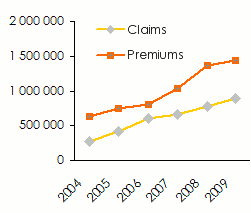
Turnover’s evolution: 2004-2009
in thousands USD| 2004 | 2005 | 2006 | 2007 | 2008 | 2009 | |
|---|---|---|---|---|---|---|
Non life | 406 718 | 485 813 | 494 481 | 596 748 | 763 755 | 871 479 |
Life | 220 914 | 267 170 | 315 285 | 439 868 | 600 399 | 562 811 |
Total | 627 632 | 752 983 | 809 766 | 1 036 616 | 1 364 154 | 1 434 290 |
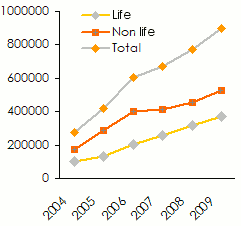
Evolution of the loss experience in life and non life insurance: 2004-2009
in thousands USD| 2004 | 2005 | 2006 | 2007 | 2008 | 2009 | |
|---|---|---|---|---|---|---|
Non life | 171 713 | 285 442 | 401 899 | 410 899 | 455 144 | 524 444 |
Life | 101 877 | 133 977 | 204 710 | 204 710 | 317 088 | 372 075 |
Total | 273 590 | 419 419 | 606 609 | 668 517 | 772 232 | 896 519 |
| in thousands USD | in thousands USD |
 |  |
Turnover per company: 2008-2009
in thousands USD| Premiums 2009 | Market shares | Premiums 2008 | Market shares | 2008/09 growth | |
|---|---|---|---|---|---|
| Non life companies | |||||
| Public sector | |||||
Misr Insurance | 462 708 | 32.3% | 414 162 | 30.4% | 11.5% |
Al Ahlia Insurance Co. | 53 843 | 3.8% | 48 374 | 3.5% | 11.1% |
Public sector total | 516 551 | 36.1% | 462 536 | 33.9% | 11.5% |
| Private sector | |||||
Suez Canal Insurance Company | 58 500 | 4.1% | 44 195 | 3.2% | 32.2% |
AIG | 42 861 | 3.0% | 36 927 | 2.7% | 15.9% |
Arab Misr Insurance Group | 39 450 | 2.8% | 31 034 | 2.3% | 26.9% |
Delta Insurance Company | 37 008 | 2.6% | 28 953 | 2.1% | 27.6% |
Allianz Insurance Company | 35 555 | 2.5% | 29 899 | 2.2% | 18.7% |
Cooperative Insurance Society | 34 892 | 2.4% | 62 866 | 4.6% | -44.6% |
Mohandes Insurance Company | 29 898 | 2.1% | 23 043 | 1.7% | 29.5% |
Bupa Egypt | 26 675 | 1.9% | 23 160 | 1.7% | 15.0% |
Royal Insurance | 17 011 | 1.2% | 11 283 | 0.8% | 50.5% |
Wethaq Takaful Insurance | 12 291 | 0.9% | - | 0.0% | - |
Egyptian Saudi Insurance House | 10 414 | 0.7% | 6 112 | 0.4% | 70.1% |
Egyptian for Takaful Insurance | 6 203 | 0.4% | - | - | - |
ACE Insurance | 3 237 | 0.2% | 3 329 | 0.2% | -2.9% |
Export Credit Guarantee Company | 874 | 0.1% | 418 | 0.03% | 109.1% |
AROPE | 59 | 0.0% | - | - | - |
Private sector total | 354 928 | 24.7% | 301 219 | 22.1% | 17.6% |
Non life total | 871 479 | 60.8% | 763 755 | 56.0% | 13.9% |
| Life companies | |||||
Life | 562 811 | 39.2% | 600 399 | 44.0% | -6.4% |
Grand total | 1 434 290 | 100.0% | 1 364 154 | 100.0% | 5.0% |
Turnover per class of business: 2005-2009
in thousands USD| 2005 | 2006 | 2007 | 2008 | 2009 | Market shares | |
|---|---|---|---|---|---|---|
| Non life | ||||||
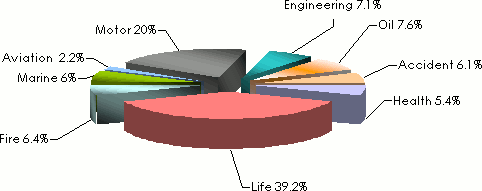
Fire | 60 198 | 66 533 | 76 951 | 81 479 | 92 582 | 6.4% |
Marine | 49 890 | 53 722 | 65 678 | 80 846 | 85 978 | 6% |
Aviation | 94 253 | 46 079 | 36 339 | 31 000 | 30 952 | 2.2% |
Motor | 101 210 | 114 370 | 146 138 | 230 106 | 287 167 | 20% |
Engineering | 48 321 | 51 852 | 77 070 | 90 091 | 101 648 | 7.1% |
Oil | 65 266 | 77 473 | 81 784 | 97 255 | 109 309 | 7.6% |
Accident | 54 817 | 60 689 | 68 799 | 80 607 | 86 888 | 6.1% |
Health | 11 858 | 23 763 | 43 989 | 72 372 | 76 956 | 5.4% |
Non life total | 485 813 | 494 481 | 596 748 | 763 755 | 871 479 | 60.8% |
| Life | ||||||
Life | 267 170 | 315 285 | 439 868 | 600 399 | 562 811 | 39.2% |
Grand total | 752 983 | 809 766 | 1 036 616 | 1 364 154 | 1 434 290 | 100% |
Breakdown per class of business in 2009
Exchange rate USD/EGP as at 31/12 | 2004 | 2005 | 2006 | 2007 | 2008 | 2009 |
6.05880 | 5.69570 | 5.66958 | 5.48613 | 5.45936 | 5.45080 |