The Indian insurance market

Insurance market features
- Regulatory authority: Insurance Regulatory and Development Authority
- Premiums (2005-2006): 25.024 billion USD
- Insurance density (2005-2006): 22.84 USD
- Penetration rate (2005-2006): 3.14%
Market structure in 2005
- State-owned life company: 1
- State-owned non life companies: 4
- Private life companies: 15
- Private non life companies: 11
- Reinsurance company: 1
Identity
- Area: 3 287 590 Km2
- Population (2006): 1 095 352 000 inhabitants
- GDP (2006): 796.1 billion USD
- GDP per capita (2006): 762 USD
- GDP growth rate (2006): 8.5%
- Inflation rate (2006): 5.3%
- Main economic sectors: agriculture, textile, chemicals, steel, services
Major cities
(in millions of inhabitants)
- Mumbai: 18
- Kolkata: 14.6
- New Delhi (capital): 13.8
Non Life gross premiums: 2004-2006
in millions USD| Fire | Marine | Miscellaneous | Total | |||||
|---|---|---|---|---|---|---|---|---|
| 2004/05 | 2005/06 | 2004/05 | 2005/06 | 2004/05 | 2005/06 | 2004/05 | 2005/06 | |
| State-owned | ||||||||
New india | 178.076 | 244.134 | 56.995 | 77.285 | 715.449 | 934.230 | 950.520 | 1 255.649 |
Oriental | 111.501 | 124.172 | 53.139 | 74.597 | 516.573 | 599.851 | 681.213 | 798.620 |
National | 121.363 | 108.316 | 56.724 | 38.891 | 679.679 | 635.168 | 857.766 | 782.375 |
United India | 133.388 | 142.805 | 55.033 | 45.126 | 476.241 | 510.028 | 664.662 | 697.959 |
Sub-total | 544.328 | 619.427 | 221.891 | 235.899 | 2 387.942 | 2 679.277 | 3 154.161 | 3 534.603 |
| Private | ||||||||
ICICI Lombard | 62.629 | 68.245 | 18.629 | 18.962 | 116.002 | 262.982 | 197.260 | 350.189 |
Bajaj Allianz | 49.530 | 77.743 | 10.148 | 12.019 | 132.559 | 191.716 | 192.237 | 281.478 |
IFFCO Tokio | 39.002 | 58.250 | 6.968 | 10.205 | 66.137 | 129.048 | 112.107 | 197.503 |
Tata AIG | 18.896 | 25.723 | 9.221 | 10.592 | 73.065 | 90.384 | 101.182 | 126.699 |
Royal Sundaram | 14.223 | 20.296 | 3.792 | 4.046 | 56.634 | 77.126 | 74.649 | 101.468 |
Cholamandalam | 10.785 | 16.112 | 3.589 | 3.761 | 23.830 | 28.838 | 38.204 | 48.711 |
HDFC Chubb | 0.408 | 1.287 | 0.112 | 0.380 | 39.124 | 42.539 | 39.644 | 44.206 |
Reliance General | 12.094 | 10.566 | 2.866 | 2.376 | 21.537 | 22.971 | 36.497 | 35.913 |
Sub-total | 207.567 | 278.222 | 168.080 | 62.341 | 528.888 | 845.604 | 791.780 | 1 186.167 |
Grand total | 751.895 | 897.649 | 389.971 | 298.240 | 2 916.830 | 3 524.881 | 3 945.941 | 4 720.770 |
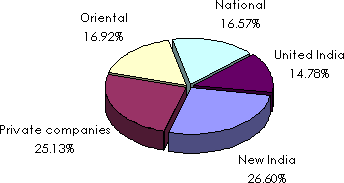
Non life market share by company: 2005-2006
Non life companies' results: 2004-2006
in millions USD| Net premiums | Net claims payable | Net profits* | ||||
|---|---|---|---|---|---|---|
| 2004/05 | 2005/06 | 2004/05 | 2005/06 | 2004/05 | 2005/06 | |
| State-owned | ||||||
New india | 879.257 | 960.763 | 655.751 | 803.542 | 180.108 | 189.283 |
Oriental | 500.681 | 553.199 | 430.785 | 456.800 | 106.480 | 73.935 |
National | 639.313 | 593.584 | 510.948 | 626.179 | 31.878 | -13.196 |
United India | 490.442 | 492.442 | 451.135 | 451.940 | 71.851 | 100.163 |
| Private | ||||||
ICICI Lombard | 72.435 | 162.360 | 34.934 | 86.117 | 12.160 | 12.061 |
Bajaj Allianz | 108.191 | 154.577 | 51.090 | 90.705 | 17.372 | 18.106 |
IFFCO Tokio | 52.993 | 105.818 | 26.914 | 53.997 | 5.336 | 5.329 |
Tata AIG | 58.638 | 74.504 | 28.327 | 35.429 | 5.507 | 5.942 |
Royal Sundaram | 45.512 | 65.681 | 25.668 | 35.765 | 1.207 | 2.243 |
Cholamandalam | 20.196 | 21.803 | 12.352 | 15.247 | -753.950 | -55.309 |
HDFC Chubb | 30.304 | 31.783 | 17.862 | 17.639 | -1.803 | 106.195 |
Reliance General | 13.986 | 12.287 | 8.659 | 7.619 | 1.627 | 4.661 |
Total | 402.259 | 628.816 | 205.808 | 342.522 | 40.654 | 48.396 |
Life turnover by company: 2004-2005
| Rank | Companies | Figures in INR | Figures in USD |
|---|---|---|---|
1 | LIC | 709 019.0 | 16 004.9 |
2 | ICICI Prudential | 23 638.2 | 533.5 |
3 | Bajaj Allianz | 10 016.8 | 226.1 |
4 | Birla Sun Life | 9 154.7 | 206.6 |
5 | HDFC Standard Life | 6 866.3 | 154.9 |
6 | SBI Life | 6 011.8 | 135.7 |
7 | Tata AIG | 4 970.4 | 112.1 |
8 | Kotak Life | 4 661.6 | 105.2 |
9 | Max New york | 4 134.3 | 93.3 |
10 | ING Vysya | 3 388.6 | 76.4 |
Total | 781 861.7 | 17 648.7 | |
Exchange rate USD/INR | 2004/05 | 2005/06 |
44.3 | 45.2 |