The Indian insurance market

Insurance market features
- Regulatory authority: Insurance Regulatory Authority of India (IRDA)
- Life and non life premiums:
49 billion USD - Insurance density (2009): 42.93 USD
- Penetration rate (2009): 4.22%
Market structure in 2009
- Insurance companies: 43
Identity
- Area: 3 287 590 Km2
- Population (2008):
1 139 964 932 inhabitants - GDP (2008): 1 159 billion USD
- GDP per capita (2008): 1 017 USD
- GDP growth rate (2008): 6.1%
- Inflation rate (2008): 6.2%
- Main economic sectors: agriculture, mining exploitation, textile industry, chemical industry, software industry
Major cities
(in number of inhabitants)
- New Delhi (capital):
22 400 000 - Mumbai: 22 300 000
- Kolkata: 16 000 000
Premiums' growth of the top ten non life companies: 2005-2009
in USD| 2005 | 2006 | 2007 | 2008 | 2009 | 2009 market shares | 2009 combined ratio | |
|---|---|---|---|---|---|---|---|
New India | 1 165 561 744 | 1 271 888 514 | 1 366 646 756 | 1 541 555 876 | 1 237 574 943 | 19.2% | 116.2% |
National | 870 352 460 | 792 493 794 | 881 003 024 | 1 007 905 682 | 823 514 445 | 12.8% | 121.6% |
United India | 672 514 664 | 706 986 198 | 805 416 854 | 937 133 736 | 820 048 509 | 12.7% | 100.4% |
Oriental | 705 881 620 | 808 949 457 | 925 583 556 | 977 392 626 | 781 733 430 | 12.2% | 121.9% |
ICICI Lombard | 199 589 624 | 354 718 926 | 688 081 612 | 828 764 272 | 652 169 151 | 10.1% | 97.3% |
Bajaj Allianz | 194 510 008 | 285 120 189 | 411 213 166 | 596 407 952 | 502 117 893 | 7.8% | 91.5% |
Reliance General | 36 927 712 | 36 378 153 | 209 993 044 | 487 772 852 | 367 082 496 | 5.7% | 103.3% |
IFFCO Tokio | 113 432 576 | 200 058 552 | 263 454 692 | 282 714 390 | 263 407 302 | 4.1% | 95.7% |
AIC | 125 556 048 | 124 561 503 | 129 987 034 | 209 278 566 | 159 770 448 | 2.5% | 69% |
Tata AIG | 102 378 016 | 128 339 829 | 163 568 610 | 196 129 584 | 157 945 464 | 2.5% | 95.8% |
Others* | 272 054 092 | 326 282 877 | 401 487 216 | 573 162 296 | 668 942 901 | 10.4% | 83.3% |
Non life total | 4 458 758 564 | 5 035 777 992 | 6 246 435 564 | 7 638 217 832 | 6 434 306 982 | 100% | 105.6% |
Premiums' growth of the top ten life companies: 2005-2009
in USD| 2005 | 2006 | 2007 | 2008 | 2009 | 2009 shares | |
|---|---|---|---|---|---|---|
LIC | 17 159 073 036 | 20 346 536 502 | 29 424 817 768 | 37 537 371 494 | 30 152 117 268 | 70.9% |
ICICI Prudential | 539 896 488 | 954 901 305 | 1 821 570 298 | 3 398 401 636 | 2 943 787 374 | 6.9% |
Bajaj Allianz | 228 783 712 | 702 235 278 | 1 230 474 248 | 2 437 162 686 | 2 036 720 484 | 4.8% |
SBI Life | 137 309 512 | 240 979 212 | 674 138 398 | 1 408 908 284 | 1 382 559 570 | 3.3% |
HDFC Standard | 156 826 292 | 351 816 831 | 657 421 274 | 1 217 555 136 | 1 066 751 073 | 2.5% |
Reliance Life | 24 336 020 | 50 245 461 | 231 272 732 | 808 295 264 | 945 567 918 | 2.2% |
Birla Sunlife | 209 093 348 | 282 294 288 | 408 998 642 | 820 010 814 | 877 524 003 | 2.1% |
Max New York | 94 427 412 | 176 619 933 | 345 364 456 | 680 278 760 | 739 436 742 | 1.7% |
Tata AIG | 113 523 936 | 197 250 579 | 314 724 836 | 512 815 310 | 526 695 750 | 1.2% |
Kotak Mahindra | 106 470 944 | 139 356 585 | 223 641 602 | 423 799 684 | 449 189 523 | 1.1% |
Others* | 154 295 620 | 284 524 083 | 596 238 718 | 1 214 064 278 | 1 397 031 003 | 3.3% |
Life total | 18 924 036 320 | 23 726 760 057 | 35 928 662 972 | 50 458 663 346 | 42 517 380 708 | 100% |
Premiums' growth per class of business: 2007-2009
in USD| 2007 | 2008 | 2009 | 2009 shares | |||
|---|---|---|---|---|---|---|
| Non life | ||||||
Fire | 1 014 887 344 | 931 460 152 | 697 458 276 | 1.4% | ||
Marine* | 390 253 456 | 468 882 624 | 391 227 111 | 0.8% | ||
Motor | 2 550 602 188 | 3 273 159 274 | 2 646 071 523 | 5.4% | ||
Health | 759 710 644 | 1 268 715 126 | 1 273 871 421 | 2.6% | ||
Personal accident | 153 239 536 | 194 282 662 | 174 349 233 | 0.4% | ||
TPL | 125 309 370 | 154 339 528 | 128 722 716 | 0.3% | ||
Miscellaneous accident | 1 252 433 026 | 1 347 378 466 | 1 122 606 702 | 2.3% | ||
| Life | ||||||
Life | 35 928 662 972 | 50 458 663 346 | 42 517 380 708 | 86.8% | ||
Total | 42 175 098 536 | 58 096 881 178 | 48 951 687 690 | 100% | ||
Market shares per class of business in 2009

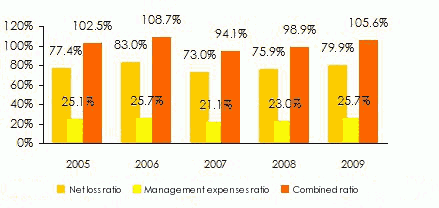
Evolution of the non life market ratios: 2005-2009
Evolution of the losses and premiums of the non life market: 2005-2009
in millions USD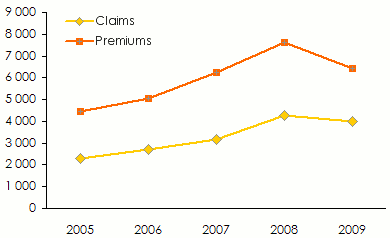
Exchange rate USD/INR as at 31/12 | 2005 | 2006 | 2007 | 2008 | 2009 |
43.74 | 44.4676 | 43.4177 | 39.89 | 51.7601 |