The Ivorian insurance market

Insurance market features
- Regulatory authority: Ministry of Economy and Finance : Insurance Department
- Life and non life premiums (2008): 368 millions USD
- Insurance density (2008): 17.8 USD
- Penetration rate (2008): 1.57%
Market structure in 2007
Actors | Number |
|---|---|
Insurance companies | 32 |
-Life companies | 11 |
-Non life companies | 21 |
Reinsurance company | 1 |
Identity
- Area: 322 463 Km2
- Population (2008): 20 590 000 inhabitants
- GDP (2008): 23.41 billion USD
- GDP per capita (2008): 1 137 USD
- GDP growth rate (2008): 2.2%
- Inflation rate (2008): 8.1%
- Main economic sectors: agriculture (coffee, cocoa, bananas, pineapple, palm oil), gum and natural rubber production, food industry, wood production, textile industry, buses and trucks assembling, construction and repair of ships
Major cities
(in number of inhabitants)
- Abidjan: 3 000 000
- Bouake: 600 000
- Daloa: 135 000
- Korogho: 115 000
- Yamoussoukro (capital):
110 000
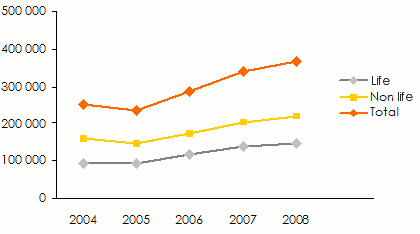
Breakdown of life and non life premiums: 2004-2008
in thousands USD| 2004 | 2005 | 2006 | 2007 | 2008 | |
|---|---|---|---|---|---|
Non life | 159 812 | 144 396 | 171 932 | 202 945 | 221 346 |
Life | 93 575 | 92 906 | 115 929 | 137 333 | 146 751 |
Total | 253 387 | 237 302 | 287 861 | 340 278 | 368 097 |
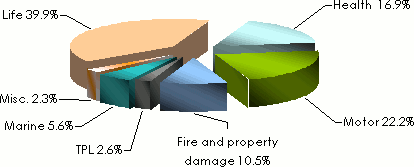
Breakdown per class of business in 2008
in thousands USD| Premiums | Market shares | |
|---|---|---|
| Non life | ||
Health | 62 121 | 16.9% |
Motor | 81 734 | 22.2% |
Fire & property | 38 764 | 10.5% |
TPL | 9 610 | 2.6% |
Marine | 20 588 | 5.6% |
Miscellaneous accident | 8 529 | 2.3% |
Non life total | 221 346 | 60.1% |
| Life | ||
Life | 146 751 | 39.9% |
Grand total | 368 097 | 100% |
Non life companies' turnover per class of business in 2008
in USD| Health | Motor | Fire & property damage | TPL | Marine | Misc. | Total | Share | |
|---|---|---|---|---|---|---|---|---|
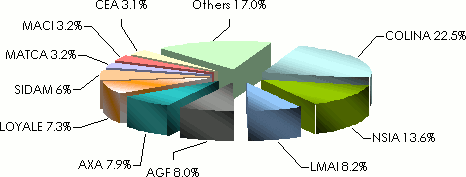
COLINA SA | 12 677 536 | 12 608 900 | 14 240 600 | 1 823 989 | 7 772 099 | 621 914 | 49 745 038 | 22.5% |
NSIA CI | 10 759 456 | 8 494 067 | 5 901 852 | 2 241 718 | 1 950 811 | 662 211 | 30 010 115 | 13.6% |
LMAI | 7 834 439 | 4 535 081 | 4 367 524 | 861 115 | 442 753 | - | 18 040 912 | 8.2% |
AGF CI* | 1 567 489 | 3 687 880 | 5 329 544 | 1 696 569 | 3 301 523 | 2 074 622 | 17 657 627 | 8.0% |
AXA | 4 175 936 | 4 989 789 | 3 509 043 | 739 555 | 3 981 848 | - | 17 396 171 | 7.9% |
LOYALE | 5 269 453 | 6 143 855 | 1 876 262 | 564 858 | 303 120 | 2 038 862 | 16 196 410 | 7.3% |
SIDAM | 7 703 121 | 4 421 605 | 498 589 | 324 226 | 169 891 | 111 561 | 13 228 993 | 6.0% |
MATCA | - | 7 081 413 | - | - | - | - | 7 081 413 | 3.2% |
MACI | 2 174 250 | 2 628 023 | 446 247 | 84 576 | 1 745 732 | - | 7 078 828 | 3.2% |
CEA | 740 930 | 4 574 259 | 834 325 | 417 162 | 351 440 | - | 6 918 116 | 3.1% |
CNA -CI | 540 445 | 3 590 495 | 362 003 | 164 481 | 117 227 | 1 463 914 | 6 238 565 | 2.8% |
SAFA | 1 457 428 | 3 609 130 | 149 654 | 77 766 | 16 074 | - | 5 310 052 | 2.4% |
ATLAS | 1 501 826 | 3 291 986 | 3 720 | 58 037 | 6 500 | 326 465 | 5 188 534 | 2.3% |
SONAR CI | 2 602 623 | 1 401 359 | 467 812 | 90 340 | 101 661 | - | 4 663 795 | 2.1% |
MCA | 1 835 942 | 2 214 757 | 236 756 | 90 765 | 151 145 | 79 752 | 4 609 117 | 2.1% |
AMSA | 298 650 | 2 954 018 | 428 560 | 247 898 | 77 185 | - | 4 006 311 | 1.8% |
FEDAS CI | 462 034 | 2 091 301 | 46 204 | 58 797 | 4 146 | 64 892 | 2 727 374 | 1.2% |
SOMAT | 216 321 | 2 140 829 | 52 643 | 31 454 | 5 536 | - | 2 446 783 | 1.1% |
A.A.A | 302 787 | 1 275 669 | 13 724 | 35 971 | 89 137 | - | 1 717 288 | 0.8% |
GMTCI | - | - | - | - | - | 542 822 | 542 822 | 0.2% |
SIAC | - | - | - | - | - | 541 454 | 541 454 | 0.2% |
Total | 62 120 666 | 81 734 416 | 38 765 062 | 9 609 277 | 20 587 828 | 8 528 469 | 221 345 718 | 100% |
Market shares of the top ten non life companies
Life companies' turnover in 2008
in USD| Turnover | Market shares | |
|---|---|---|
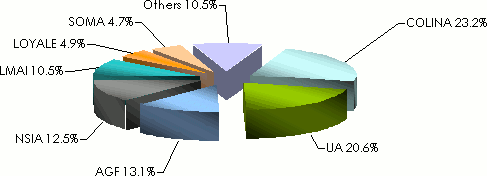
COLINA VIE | 34 022 368 | 23.2% |
UA VIE | 30 228 059 | 20.6% |
AGF VIE | 19 159 475 | 13.1% |
NSIA VIE | 18 350 312 | 12.5% |
LMAI VIE | 15 410 132 | 10.5% |
LOYALE VIE | 7 239 476 | 4.9% |
SOMA VIE | 6 886 707 | 4.7% |
BENEFICIAL LIFE | 6 638 848 | 4.5% |
STAM VIE | 5 881 118 | 4.0% |
A.A.A VIE | 2 532 097 | 1.7% |
CEA VIE | 402 933 | 0.3% |
Total | 146 751 525 | 100% |
Market shares of the main life companies in 2008
Loss ratio per class of business: 2006-2008
| 2006 | 2007 | 2008 | |
|---|---|---|---|
Health | 68.5% | 72.6% | 81.2% |
Motor | 20.5% | 20.0% | 25.7% |
Fire & property | 33.6% | 103.6% | 37.1% |
TPL | 27.6% | 20.9% | 18.1% |
Marine | 8.3% | 14.3% | 38.2% |
Miscellaneous accident | 44.7% | 23.2% | 16.7% |
Exchange rate USD/XOF as at 31/12 | 2004 | 2005 | 2006 | 2007 | 2008 |
480.076 | 545.853 | 477.782 | 436.872 | 454.545 |
Source: Association des Sociétés d'Assurances de Côte d'Ivoire (ASA-CI)