The Kenyan insurance market

Insurance market features
- Regulatory authority: Ministry of Finance Insurance department
- Premiums (2004): 414 million USD
- Insurance density (2004): 12.77 USD
- Penetration rate (2004): 2.76%
Market structure in 2004
Actors | Number |
|---|---|
Insurance companies | 40 |
Life companies | 6 |
Non life companies | 19 |
Life & non life companies | 15 |
Reinsurance companies | 2 |
Brokers | 190 |
Identity
- Area: 582 650 Km2
- Population (2004): 32 400 000 inhabitants
- GDP (2004): 15 billion USD
- GDP per capita (2004): 463 USD
- GDP growth rate (2004): 2.1%
- Inflation rate (2004): 11.7%
- Main economic sectors: agricultural products (tea, coffee, corn, wheat, sugarcane) aluminium, cement, tourism
Major cities
(in number of inhabitants)
- Nairobi (capital): 3 000 000
- Mombasa: 900 000
- Kisumu: 400 000
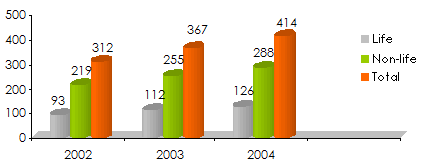
Turnover evolution: 2002-2004
in thousands USD| 2002 | 2003 | 2004 | 2003/2004 Growth rate | |
|---|---|---|---|---|
| Life | ||||
Written Premiums | 93 000 | 112 000 | 126 000 | 12.50% |
Market shares | 30% | 31% | 30% | - |
| Non life | ||||
Written Premiums | 219 000 | 255 000 | 288 000 | 12.94% |
Market shares | 70% | 69% | 70% | - |
Total | 312 000 | 367 000 | 414 000 | 12.81% |
in millions USD
2004 top ten of insurance companies
Non life companies | Life companies | |
|---|---|---|
| in thousands USD | in thousands USD |
Companies | Premiums | Market shares |
|---|---|---|
Kenindia Insurance | 26 700 | 9.27% |
Blue Shield Insurance | 21 500 | 7.47% |
APA | 19 700 | 6.83% |
ALICO | 16 900 | 5.87% |
UAP Provincial | 16 800 | 5.85% |
Invesco | 13 600 | 4.72% |
Jubilee Insurance | 13 500 | 4.67% |
Standard Insurance | 13 100 | 4.55% |
Madison Insurance | 12 900 | 4.47% |
Heritage AII | 11 900 | 4.14% |
Companies | Premiums | Market shares |
|---|---|---|
Insurance Co. of East Africa | 23 900 | 18.96% |
ALICO (CFC Life) | 18 500 | 14.65% |
British American Insurance Co. | 15 400 | 12.26% |
Pan Africa | 13 800 | 10.97% |
Jubilee Insurance | 12 700 | 10.10% |
Kenindia Assurance Co. | 8 500 | 6.74% |
Madison Insurance Co. | 7 600 | 6.02% |
Old Mutual Insurance Co. | 6 600 | 5.20% |
CIC | 6 000 | 4.73% |
Heritage AII | 2 800 | 2.26% |
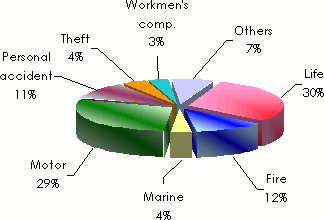
Premiums split by classes of business in 2004
in thousands USD| Written premiums | Market shares | |
|---|---|---|
| Non life | ||
Motor | 118 400 | 29% |
Fire | 48 700 | 12% |
Personal accident | 46 500 | 11% |
Theft | 16 600 | 4% |
Marine | 15 100 | 4% |
Workmen's compensation | 13 900 | 3% |
Engineering | 9 300 | 2% |
Miscellaneous | 8 300 | 2% |
TPL | 8 200 | 2% |
Aviation | 3 200 | 1% |
Non life total | 288 200 | 70% |
| Life | ||
Life total | 125 800 | 30% |
Grand total | 414 000 | 100% |
Non-life loss ratios: 2000-2004
| 2000 | 2001 | 2002 | 2003 | 2004 | |
|---|---|---|---|---|---|
Aviation | 68% | 48% | 50% | 72% | 132% |
Engineering | 95% | 23% | 17% | 53% | 36% |
Domestic fire | 42% | 29% | 37% | 26% | 27% |
Industrial fire | 32% | 38% | 47% | 37% | 39% |
TPL | 87% | 116% | 136% | 55% | 47% |
Marine | 60% | 46% | 42% | 34% | 36% |
Motor private | 67% | 63% | 70% | 68% | 71% |
Motor commercial | 86% | 75% | 44% | 55% | 51% |
Personal accident | 84% | 67% | 65% | 68% | 64% |
Theft | 78% | 72% | 67% | 69% | 56% |
Workmen's compensation | 80% | 79% | 92% | 106% | 115% |
Miscellaneous | 36% | 43% | 27% | 26% | 44% |
Market average | 72% | 59% | 56% | 62% | 60% |
Exchange rate USD/KES as at 31/12 | 2002 | 2003 | 2004 | 2005 |
78,75 | 75,94 | 79,17 | 76,38 |
Sources: Association of Kenyan Insurers, Ministry of Finance, Kenya - Insurance department