The Lebanese insurance market

Insurance market features
- Regulatory authority: Ministry of Economy and Trade
- Premiums (2006): 640 679 295 USD
- Insurance density (2006): 139 USD
- Penetration rate (2006): 2.82%
Market structure in 2006
- Composite companies: 49
- Reinsurance company: 1
- Reinsurance branches: 3
Identity
- Area: 10 452 Km2
- Population (2006): 4 600 000 inhabitants
- GDP (2006): 22.722 billion USD
- GDP per capita (2006): 4 940 USD
- GDP growth rate (2006): 0.3%
- Inflation rate (2006): 5.6%
- Main economic sectors: agriculture, textile industry, banking, tourism
Main cities
(in number of inhabitants)
- Beirut: 1 171 000
- Tripoli: 212 900
- Saida: 149 000
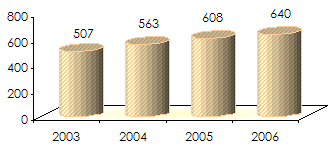
Turnover's evolution: 2003-2006
in millions USD| Gross written premiums | 2003 | 2004 | 2005 | 2006 | 2005/06 growth rate |
|---|---|---|---|---|---|
Non life | 370 | 389 | 421 | 458 | +5.2% |
Life | 137 | 174 | 187 | 182 | |
Total | 507 | 563 | 608 | 640 |
Non life premiums split by class of business: 2003-2006
in USD| Classes of business | 2003 | 2004 | 2005 | 2006 |
|---|---|---|---|---|
Fire | 33 409 678 | 34 787 278 | 41 133 727 | 38 708 063 |
Marine cargo | 12 844 386 | 17 470 441 | 19 511 982 | 19 455 987 |
Motor | 113 948 964 | 120 978 775 | 131 067 574 | 132 863 328 |
Health | 145 707 027 | 150 849 088 | 163 217 975 | 171 482 176 |
Workmen's compensation | 15 416 977 | 15 872 302 | 17 393 586 | 20 198 479 |
GTPL | 6 701 083 | 18 204 277 | 7 248 233 | 8 720 138 |
Engineering | 4 919 466 | 3 932 135 | 3 223 745 | 6 826 295 |
Credit | 3 075 168 | 2 519 883 | 1 803 215 | 1 119 678 |
Other risks | 34 272 142 | 25 093 135 | 36 904 858 | 59 617 228 |
Total | 370 294 891 | 389 707 314 | 421 504 895 | 458 991 372 |
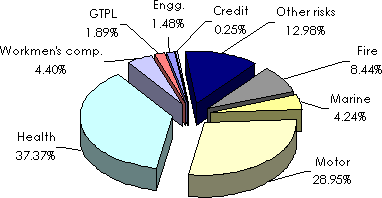
Non life premiums split by class of business: 2006
Profitability: 2003-2006
in USD| Classes | 2003 | % of T/O* | 2004 | % of T/O* | 2005 | % of T/O* | 2006 | % of T/O* |
|---|---|---|---|---|---|---|---|---|
| Non life | ||||||||
Fire | 2 480 398 | 7.42 | 1 802 437 | 5.18 | 3 568 857 | 8.68 | 3 398 504 | 8.78 |
Marine cargo | 1 939 711 | 15.10 | 1 344 123 | 7.69 | 3 068 909 | 15.73 | 3 314 528 | 17.03 |
Motor | 6 829 912 | 5.99 | -143 336 | -0.12 | 4 571 140 | 3.49 | 6 380 732 | 4.80 |
Health | 347 677 | 0.24 | -8 366 847 | -5.55 | 2 658 833 | 1.63 | 5 023 305 | 2.93 |
Workmen's compensation | -1 352 581 | -8.77 | -2 481 654 | -15.63 | -1 738 619 | -10 | -299 246 | -1.48 |
GTPL | -7 691 | -0.11 | 2 024 429 | 11.12 | 887 193 | 12.24 | 2 563 886 | 29.40 |
Engineering | 458 960 | 9.33 | -1 201 928 | -30.57 | 531 972 | 16.50 | 982 644 | 14.39 |
Credit | 337 250 | 10.97 | -100 579 | -3.99 | 562 537 | 31.20 | 297 612 | 26.58 |
Other risks | 3 814 621 | 11.13 | 2 126 115 | 8.47 | 6 488 441 | 17.58 | 9 495 699 | 15.93 |
Non life total | 14 848 257 | 3.81 | - 4 997 240 | -1.28 | 20 599 263 | 48.46 | 31 157 664 | 6.79 |
| Life | ||||||||
Life | 10 602 379 | 7.73 | 11 859 689 | 6.82 | 12 608 473 | 6.72 | 20 057 549 | 11.04 |
Total | 25 450 636 | 6.53 | 6 862 449 | 1.76 | 33 207 736 | 5.45 | 51 215 212 | 7.99 |
Exchange rate LBP/USD as at 31/12 | 2003 | 2004 | 2005 | 2006 |
0.0006779 | 0.0006604 | 0.0006662 | 0.0006863 |