The Malian insurance market

Insurance market features
- Regulatory authority: Ministry of Finance - Department of National Treasury and Public Accounting
- Premiums (2003): 20.8 millions USD
- Insurance density (2003) : 1.78 USD
- Penetration rate (2003) : 0.5%
Market structure
Actors | Number |
|---|---|
Non life insurance companies | 5 |
Life insurance companies | 1 |
Brokers | 25 |
General agents | 37 |
Identity
- Area: 1 240 190 Km2
- Population (2003): 11.7 million inhabitants
- GDP (2003): 4.3 billion USD
- GDP per capita (2003): 368 USD
- GDP growth rate (2003): 6%
- Inflation rate (2003): 1.8%
- Main economic sectors: Agriculture (cotton, corn, cereal), cattle breeding, food industries, building and mining (gold and phosphate)
Major towns
(in number of inhabitants)
- Bamako (capital): 850 000
- Segou: 110 000
- Sikasso: 92 000
- Mopti: 88 000
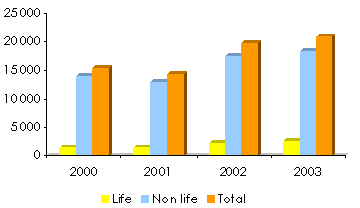
Turnover evolution: 2000-2003
in thousands USD| Premiums | 2000 | 2001 | 2002 | 2003 |
|---|---|---|---|---|
Non life | 13 913 | 12 923 | 17 413 | 18 342 |
Life | 1 393 | 1 398 | 2 213 | 2 484 |
Total | 15 306 | 14 321 | 19 626 | 20 826 |
Turnover's evolution split by class of business: 2000-2003
in thousands USD| 2000 | 2001 | 2002 | 2003 | |
|---|---|---|---|---|
| Non life | ||||
Motor | 6 691 | 6 830 | 8 141 | 8 499 |
Fire and property damage | 3 191 | 2 397 | 3 460 | 3 581 |
Acc. Health | 554 | 568 | 1 614 | 1 815 |
TLP | 383 | 447 | 616 | 557 |
Marine | 1 874 | 1 636 | 1 926 | 2 619 |
Miscellaneous | 1 025 | 858 | 1 656 | 1 118 |
Acceptances | 195 | 187 | 0 | 153 |
Total non life | 13 913 | 12 923 | 17 413 | 18 342 |
| Life | ||||
Total life | 1 393 | 1 398 | 2 213 | 2 484 |
Grand total | 15 306 | 14 321 | 19 626 | 20 826 |
Premiums and claims split by company: 2002-2003
in thousands USD| Premiums | Incurred claims | Loss ratio | ||||
|---|---|---|---|---|---|---|
| 2002 | 2003 | 2002 | 2003 | 2002 | 2003 | |
| Non life companies | ||||||
AGF Mali Assurances | 2 582 | 3 588 | 663 | 1 066 | 25.7% | 29.7% |
CNAR | 3 675 | 3 330 | 1 906 | 1 516 | 51.9% | 45.5% |
COLINA SA | 3 761 | 3 919 | 992 | 1 515 | 26.4% | 38.7% |
Assurances LAFIA | 4 899 | 5 475 | 1 640 | 2 581 | 33.5% | 47.1% |
SABU NYUMAN | 2 496 | 2 032 | 894 | 1 051 | 35.8% | 51.7% |
Total non life | 17 413 | 18 342 | 6 095 | 7 729 | 35.0% | 42.1% |
Life companies | ||||||
Société nouvelle d'assurance vie | 2 213 | 2 484 | 543 | 713 | 24.5% | 28.7% |
Total life | 2 213 | 2 484 | 543 | 713 | 24.5% | 28.7% |
Grand total | 19 626 | 20 826 | 6 638 | 8 442 | 33.8% | 40.5% |
2003 Market share
By class of business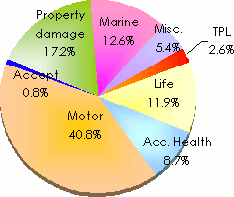 | By company |
Exchange rate USD/XAF as at 31/12 | 2000 | 2001 | 2002 | 2003 |
708.039 | 743.922 | 625.497 | 576.766 |