The Mauritian insurance market

Insurance market features
- Regulatory authority: Financial Services Commission
- Life and non life premiums (2012): 657 million USD
- Insurance density (2012): 505.4 USD
- Penetration rate (2012): 5.97%
Market structure in 2012
Actors | Life | Non life | Total |
|---|---|---|---|
Insurance companies | 10 | 13 | 23 |
Country profile
- Area: 2 040 km2
- Population (2012): 1 300 000 inhabitants
- GDP (2012): 11 billion USD
- GDP per capita (2012): 8 462 USD
- GDP growth rate(2012): 3.2%
- Inflation rate(2012): 3.9%
- Main economic sectors: food industry (sugar), textile, tourism and services.
Main cities
(in number of inhabitants in 2011)
- Port Louis (capital): 140 608
- Vacoas-Phoenix: 105 559
- Beau Bassin-Rose Hill: 103 098
Evolution of life and non life premiums: 2008-2012
in thousands USD| 2008 | 2009 | 2010 | 2011 | 2012 | |
|---|---|---|---|---|---|
Non life | 158 733 | 179 101 | 189 871 | 222 073 | 202 378 |
Life | 304 730 | 325 337 | 407 460 | 460 491 | 454 889 |
Total | 463 463 | 504 438 | 597 331 | 682 564 | 657 267 |
Evolution of gross written premiums: 2008-2012
in thousands USD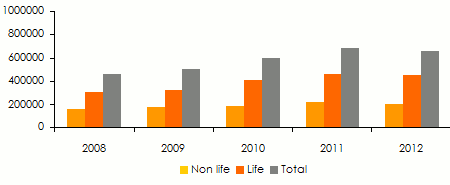
Evolution of gross life and non life claims: 2008-2012
in thousands USD| 2008 | 2009 | 2010 | 2011 | 2012 | |
|---|---|---|---|---|---|
Non life | 78 805 | 81 453 | 87 233 | 115 545 | 100 592 |
Life* | 177 995 | 208 367 | 265 219 | 376 246 | 328 942 |
Total | 256 800 | 289 820 | 352 452 | 491 791 | 429 534 |
Evolution of gross claims: 2008-2012
in thousands USD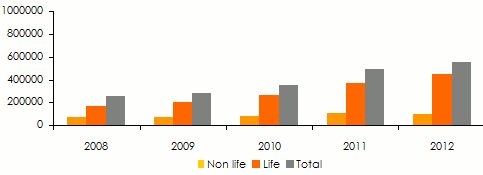
Turnover’s evolution per class of business: 2008-2012
in thousands USD| 2008 | 2009 | 2010 | 2011 | 2012 | 2012 shares | |
|---|---|---|---|---|---|---|
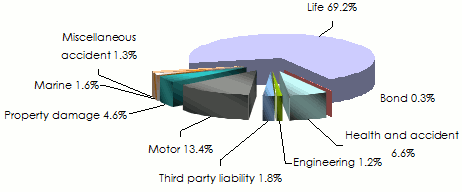
Health and accident | 26 004 | 32 265 | 36 522 | 46 239 | 43 226 | 6.6% |
Engineering | 8 314 | 9 924 | 10 667 | 9 526 | 7 709 | 1.2% |
Third party liability | 7 621 | 11 629 | 14 990 | 15 837 | 11 559 | 1.8% |
Motor | 63 501 | 73 560 | 77 754 | 91 570 | 88 319 | 13.4% |
Property damage | 29 219 | 31 014 | 29 132 | 34 103 | 30 235 | 4.6% |
Marine | 14 004 | 13 189 | 10 588 | 12 630 | 10 808 | 1.6% |
Miscellaneous accident | 9 870 | 7 274 | 9 458 | 10 508 | 8 512 | 1.3% |
Bond | 200 | 246 | 760 | 1 660 | 2 010 | 0.3% |
Total non life | 158 733 | 179 101 | 189 871 | 222 073 | 202 378 | 30.8% |
life | 304 730 | 325 337 | 407 460 | 460 491 | 454 889 | 69.2% |
Grand total | 463 463 | 504 438 | 597 331 | 682 564 | 657 267 | 100% |
Turnover’s breakdown per class of business in 2012
Turnover per class of business and per non life company in 2012
in thousands USD| Health and accident | TPL | Miscellaneous accident 1 | Motor | Property damage | Marine | Total | 2012 shares | |
|---|---|---|---|---|---|---|---|---|
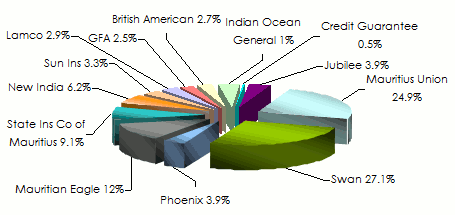
Swan | 20 841 | 1 993 | 7 708 | 11 023 | 10 456 | 2 943 | 54 964 | 27.1% |
Mauritius Union | 9 690 | 4 450 | 3 972 | 25 337 | 5 521 | 1 434 | 50 404 | 24.9% |
Mauritian Eagle | 4 024 | 1 573 | 1 483 | 6 593 | 7 038 | 3 488 | 24 199 | 12% |
State Ins. of Mauritius | 1 551 | 2 938 | 1 205 | 7 810 | 2 264 | 2 646 | 18 414 | 9.1% |
New India | 36 | 45 | 1 553 | 7 985 | 2 808 | 43 | 12 470 | 6.2% |
Phoenix | 38 | 33 | 120 | 7 470 | 257 | 5 | 7 923 | 3.9% |
Jubilee | 1 530 | 287 | 343 | 4 890 | 698 | 140 | 7 888 | 3.9% |
Sun Insurance | 61 | 119 | 396 | 5 102 | 944 | 50 | 6 672 | 3.3% |
Lamco Insurance | 18 | 18 | 105 | 5 606 | 140 | 37 | 5 924 | 2.9% |
GFA Insurance | 13 | 98 | 53 | 4824 | 84 | 10 | 5 082 | 2.5% |
British American Ins. | 5 418 | - | - | - | - | - | 5 418 | 2.7% |
Indian Ocean General | 6 | 5 | 203 | 1 679 | 25 | 12 | 1 930 | 1% |
Credit Guarantee | - | - | 1 090 | - | - | - | 1 090 | 0.5% |
Total | 43 226 | 11 559 | 18 231 | 88 319 | 30 235 | 10 808 | 202 378 | 100% |
Market shares of non life companies in 2012
Earned premiums, incurred losses and loss ratio per non life insurance in 2012
in thousands USD| Net earned premiums | Net incurred losses | Net loss ratio | |
|---|---|---|---|
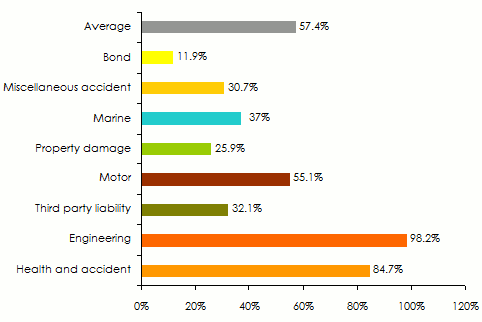
Health and accident | 25 927 | 21 958 | 84.7% |
Engineering | 1 364 | 1 339 | 98.2% |
Third party liability | 4 582 | 1 472 | 32.1% |
Motor | 78 126 | 43 064 | 55.1% |
Property damage | 7 952 | 2 060 | 25.9% |
Marine | 4 762 | 1 761 | 37% |
Miscellaneous accident | 2 682 | 824 | 30.7% |
Bond | 965 | 115 | 11.9% |
Grand total | 126 360 | 72 593 | 57.4% |
Loss ratio per class of business in 2012
Turnover of life insurance companies in 2012
in thousands USD| Turnover 2011 | Turnover 2012 | 2011-2012 evolution | 2012 shares | |
|---|---|---|---|---|
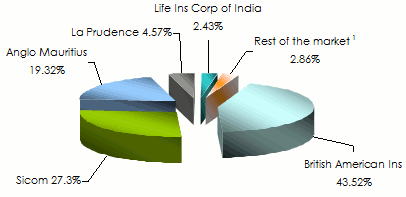
British American Insurance | 233 039 | 197 981 | -15% | 43.52% |
Sicom | 95 773 | 124 121 | 29.6% | 27.30% |
Anglo Mauritius | 78 783 | 87 893 | 11.6% | 19.32% |
La Prudence Mauricienne | 22 096 | 20 796 | -5.9% | 4.57% |
Life Insurance Corporation of India | 11 307 | 11 050 | -2.3% | 2.43% |
Island Life | 5 300 | 6 111 | 15.3% | 1.34% |
Mauritian Eagle Life | 2 146 | 6 048 | 181.8% | 1.33% |
Phoenix | 717 | 569 | -20.6% | 0.12% |
Indian Ocean General Assurance | 224 | 178 | -20.5% | 0.04% |
Lamco | 281 | 142 | -49.5% | 0.03% |
CIM Life | 10 825 | - | - | - |
Total | 460 491 | 454 889 | -1.2% | 100% |
Market shares of the top five life companies in 2012
 * 6 companies Source: Financial Services Commission, Mauritius
 Exchange rate MUR/USD as at 31/12 | 2008 | 2009 | 2010 | 2011 | 2012 |
0.03352 | 0.03421 | 0.03406 | 0.03555 | 0.03273 |