The Togolese insurance market

Insurance market features
- Regulatory authority : Togo Insurers' Committee
- Premiums (2004): 31 310 000 USD
- Insurance density (2004): 5.13 USD
- Penetration rate (2004): 1.4%
Market structure in 2004
Actors | Number |
|---|---|
Insurance companies | 8 |
Life companies | 3 |
Non life companies | 5 |
Reinsurance companies | 1 |
Brokers | 18 |
General agents | 11 |
Commercial agents | 121 |
Identity
- Area: 56 785 Km2
- Population (2004): 6 100 000 inhabitants
- GDP (2004): 2.229 billion USD
- GDP per capita (2004): 365 USD
- GDP growth rate (2004): 3%
- Inflation rate (2004): 1.2%
- Main economic sectors: phosphate mining, cement, cocoa, coffee, cotton, subsistence agriculture
Major cities
(in number of inhabitants)
- Lomé (capital): 796 000
- Sokodé: 123 000
- Kara: 110 000
- Kpalimé: 102 000
Main economic indicators: 2000-2004
in USD| 2000 | 2001 | 2002 | 2003 | 2004 | |
|---|---|---|---|---|---|
GDP | 1 359 000 000 | 1 288 000 000 | 1 609 000 000 | 1 887 000 000 | 2 229 000 000 |
GDP per capita | 295 | 274 | 335 | 385 | 365 |
Insurance density | 3.17 | 3.53 | 4.38 | 5.02 | 5.13 |
Penetration rate | 1.07% | 1.28% | 1.3% | 1.3% | 1.4% |
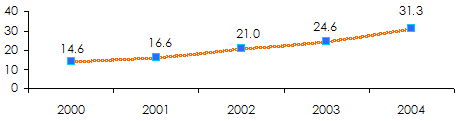
Turnover evolution: 2000-2004
in millions USD
| Written premiums | 2000 | 2001 | 2002 | 2003 | 2004 | 2003/2004 growth rate |
|---|---|---|---|---|---|---|
Non life | 11.8 | 13.2 | 16.7 | 19.2 | 24.9 | +26.88% |
Life | 2.8 | 3.4 | 4.3 | 5.4 | 6.4 | |
Total | 14.6 | 16.6 | 21.0 | 24.6 | 31.3 |
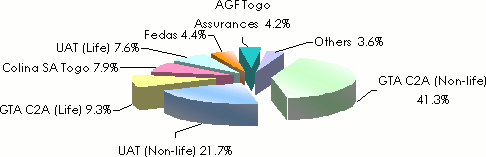
Main companies' life & non-life turnover split in 2004
in millions XOF/USD| Turnover in XOF | Turnover in USD | Market share | |
|---|---|---|---|
GTA - C2A (Non life) | 6 221 | 12.93 | 41.3% |
UAT Non life | 3 260 | 6.78 | 21.7% |
GTA - C2A (Life) | 1 401 | 2.91 | 9.3% |
Colina SA Togo | 1 201 | 2.50 | 7.9% |
UAT Life | 1 140 | 2.37 | 7.6% |
Fedas | 664 | 1.38 | 4.4% |
AGF Togo Assurances | 626 | 1.30 | 4.2% |
Others | 547 | 1.14 | 3.6% |
Total | 15 060 | 31.31 | 100.0% |
Premiums* split by class of business: 2003-2004
in millions USD| 2003 | % | 2004 | % | |
|---|---|---|---|---|
| Non life | ||||
Motor | 8.91 | 36% | 9.74 | 32% |
Accident & Health | 5.00 | 20% | 7.12 | 23% |
Fire | 2.59 | 11% | 3.80 | 12% |
Marine | 1.53 | 6% | 1.69 | 5% |
Other risks | 0.37 | 2% | 1.68 | 5% |
GTPL | 0.75 | 3% | 0.75 | 2% |
Non life total | 19.15 | 78% | 24,78 | 79% |
| Life | ||||
Life total | 5.48 | 22% | 6.42 | 21% |
Grand total | 24.63 | 100% | 31.20 | 100% |
Premiums* split by class of business in 2004
in millions USD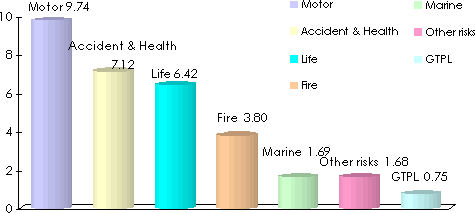 * Figures excluding reinsurance acceptances
 Life & Non–life loss ratio: 2000-2004
| 2000 | 2001 | 2002 | 2003 | 2004 | |
|---|---|---|---|---|---|
Non-life L/R | 191% | 97% | 43% | 47% | 51% |
Life L/R | 69% | 44% | 60% | 50% | 76% |
Non-life & life L/R | 167% | 86% | 46% | 48% | 56% |
Exchange rate USD/XOF as at 31/12 | 2000 | 2001 | 2002 | 2003 | 2004 |
696 | 740 | 625 | 522 | 481 |
Source: FANAF - Insurance market in Africa : Figures 2000 - 2004