The Zimbabwean insurance market

Insurance market features
- Regulatory authority : Insurance and Pensions Commission
- Life and non life premiums (2011): 158 967 000 USD
- Insurance density (2010): 9.33 USD
- Penetration rate (2010): 1.56%
Market structure 2011
Market actors | Number |
|---|---|
Insurance companies | 26 |
Reinsurance companies | 8 |
Brokers | 27 |
Country profile
- Area : 390 757 km2
- Population (2010): 12 571 000 inhabitants
- GDP (2010): 7 475 995 911 USD
- GDP per capita (2010): 595 USD
- GDP growth rate (2010): 9%
- Inflation rate (2010): 17.5%
- Main economic activities: tobacco culture, mining (coal, gold, platinum, copper, nickel, tin, clay, ore), metallurgy industry, wood, chemicals and fertilisers, textile and shoes, food industry and beverages.
Major cities
(in number of inhabitants)
- Harare (capital): 2 million
- Bulawayo: 1 million
- Mutare: 162 000
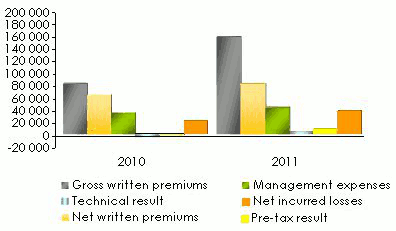
Main technical highlights: 2010-2011
in USD| 2010 | 2011 | 2010/11 evolution | |
|---|---|---|---|
Gross written premiums | 117 314 000 | 158 967 000 | 35.5% |
Net written premiums | 64 076 000 | 82 431 000 | 28.6% |
Net earned premiums | 56 963 000 | 80 749 000 | 41.8% |
Net incurred losses | 21 734 000 | 37 389 000 | 72% |
Management expenses* | 35 039 000 | 43 689 000 | 24.7% |
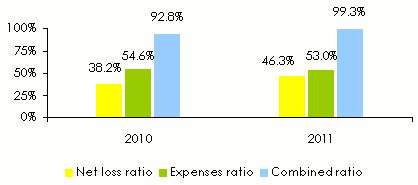
Net loss ratio | 38.2% | 46.3% | 21.4% |
Net expenses ratio | 54.6% | 53% | -2.9% |
Combined ratio | 92.8% | 99.3% | 7.1% |
Technical result | - 5 363 000 | 3 545 000 | - |
Financial income | 1 826 000 | 2 487 000 | 36.2% |
Pre-tax result | - 2 206 000 | 7 937 000 | - |
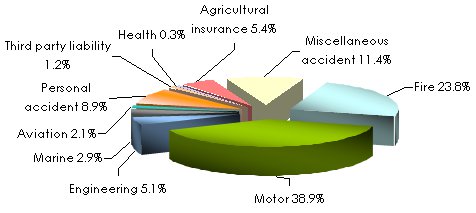
Turnover’s breakdown per class of business in 2011
in USD| 2011 | 2011 shares | |
|---|---|---|
Fire | 37 902 000 | 23.8% |
Motor | 61 821 000 | 38.9% |
Engineering | 8 182 000 | 5.1% |
Marine | 4 572 000 | 2.9% |
Aviation | 3 385 000 | 2.1% |
Personal accident | 14 083 000 | 8.9% |
Third party liability | 1 843 000 | 1.2% |
Health | 554 000 | 0.3% |
Agricultural insurance | 8 531 000 | 5.4% |
Miscellaneous accident | 18 094 000 | 11.4% |
Total | 158 967 000 | 100% |
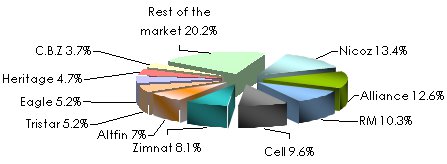
2011 ranking of premiums and results per company
in USD| Gross written premiums | Market shares | Net written premiums | Underwriting result | Net result* | |
|---|---|---|---|---|---|
Nicoz | 21 245 000 | 13.4% | 13 410 000 | -104 000 | 648 000 |
Alliance | 19 974 000 | 12.6% | 11 849 000 | 759 000 | 751 000 |
RM | 16 422 000 | 10.3% | 10 497 000 | 1 190 000 | 1 232 000 |
Cell | 15 303 000 | 9.6% | 5 807 000 | 1 127 000 | 1 130 000 |
Zimnat | 12 933 000 | 8.1% | 4 455 000 | -877 000 | -436 000 |
Altfin | 11 074 000 | 7.0% | 5 765 000 | 47 000 | 113 000 |
Tristar | 8 309 000 | 5.2% | 3 077 000 | -1 001 000 | 562 000 |
Eagle | 8 216 000 | 5.2% | 3 115 000 | 778 000 | 855 000 |
Heritage | 7 386 000 | 4.7% | 3 726 000 | 461 000 | 508 000 |
C.B.Z | 5 904 000 | 3.7% | 2 413 000 | 375 000 | 331 000 |
Credsure | 4 304 000 | 2.7% | 1 635 000 | 420 000 | 360 000 |
Global | 4 201 000 | 2.6% | 846 000 | 24 000 | 38 000 |
Tetrad Hail | 4 007 000 | 2.5% | 1 082 000 | 2 268 000 | 2 532 000 |
SFG | 3 391 000 | 2.1% | 1 628 000 | -1 526 000 | -1 088 000 |
Champions | 3 213 000 | 2.0% | 2 484 000 | 471 000 | 775 000 |
Evolution | 2 623 000 | 1.7% | 1 531 000 | 465 000 | 446 000 |
Clarion | 2 013 000 | 1.3% | 1 859 000 | 69 000 | 57 000 |
Allied | 1 656 000 | 1.0% | 1 103 000 | 102 000 | 106 000 |
Quality | 1 643 000 | 1.0% | 1 470 000 | 205 000 | 207 000 |
KMFS | 1 459 000 | 0.9% | 1 386 000 | -20 000 | 75 000 |
Regal | 1 353 000 | 0.9% | 1 345 000 | 272 000 | 199 000 |
Jupiter | 1 239 000 | 0.8% | 1 148 000 | -1 858 000 | -1 848 000 |
Excellence | 659 000 | 0.4% | 494 000 | 49 000 | 49 000 |
Hamilton | 244 000 | 0.2% | 140 000 | -69 000 | -347 000 |
Suremed | 156 000 | 0.1% | 156 000 | -91 000 | -91 000 |
Sanctuary | 40 000 | 0.0% | 10 000 | 9 000 | 54 000 |
Total | 158 967 000 | 100% | 82 431 000 | 3 545 000 | 7 218 000 |
Breakdown per class of business of the main ten companies in 2011
Premiums, incurred losses and management expenses of the main ten companies in 2011
in USD| Net written premiums | Net earned premiums | Net incurred losses | Management expenses* | |
|---|---|---|---|---|
Nicoz | 13 410 000 | 12 600 000 | 7 098 000 | 5 776 000 |
Alliance | 11 849 000 | 12 014 000 | 7 582 000 | 3 640 000 |
RM | 10 497 000 | 10 278 000 | 4 998 000 | 4 134 000 |
Cell | 5 807 000 | 5 187 000 | 2 451 000 | 1 663 000 |
Zimnat | 4 455 000 | 4 303 000 | 1 840 000 | 3 340 000 |
Altfin | 5 765 000 | 5 630 000 | 2 884 000 | 2 674 000 |
Tristar | 3 077 000 | 3 823 000 | 1 154 000 | 3 671 000 |
Eagle | 3 115 000 | 3 201 000 | -1 211 000 | 4 636 000 |
Heritage | 3 726 000 | 3 282 000 | 1 070 000 | 1 807 000 |
C.B.Z | 2 413 000 | 2 359 000 | 703 000 | 1 259 000 |
Total | 64 114 000 | 62 677 000 | 28 569 000 | 32 600 000 |
Rest of the market | 18 317 000 | 18 072 000 | 8 820 000 | 11 089 000 |
Grand total | 82 431 000 | 80 749 000 | 37 389 000 | 43 689 000 |
Technical ratios of the main ten companies in 2011
| Net loss ratios | Net expenses ratio* | Combined ratio | |
|---|---|---|---|
Nicoz | 56.3% | 43.1% | 99.4% |
Alliance | 63.1% | 30.7% | 93.8% |
RM | 48.6% | 39.4% | 88% |
Cell | 47.3% | 28.6% | 75.9% |
Zimnat | 42.7% | 75% | 117.7% |
Altfin | 51.2% | 46.4% | 97.6% |
Tristar | 30.2% | 119.3% | 149.5% |
Eagle | -37.8% | 148.8% | 111% |
Heritage | 32.6% | 48.5% | 81.1% |
C.B.Z | 29.8% | 52.2% | 82% |
Total | 45.6% | 50.8% | 96.4% |
Rest of the market | 48.8% | 60.5% | 109.3% |
Grand total | 46.3% | 53% | 99.3% |