

The economic losses caused by natural disasters amounted to 160 billion USD in 2018 decreasing compared to the 350 billion USD recorded in 2017.
As in previous years, it was the United States that paid the heaviest price. Hurricanes Michael and Florence, the California fires and the Hawaii volcanic eruption are among the most expensive events of the year.
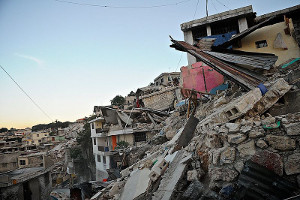
Natural disasters of 2018: Coastal areas are the most vulnerable
|
According to the survey conducted by Swiss Re, the series of events occurring in 2018 highlights, once again, the vulnerability of coastal areas where populations and material goods are concentrated.
In these high-risk areas, extreme weather conditions can quickly turn into natural disasters in terms of losses.
Related article: Natural disasters in 2018: economic and insured losses
List of major natural disasters in 2018
In 2018, the number of natural disasters worldwide increased by 13%, from 740 events in 2017 to 850 one year later. With 10 400 casualties, the human toll remains heavy despite a 20% decrease compared to the previous year.
The cost of insured losses declined by 42%, from 140 to 80 billion USD, that is half of the economic losses.
| Date | Country (region) | Natural disaster | Human losses | Economic losses | Insured losses |
| 08-25/11 | United Sates (California) | Camp Fire | 86 | 16.5 billion USD | 12.5 billion USD |
| 08-10/10 | United States (Florida) | Hurricane Michael | 45 | 16 billion USD | 10 billion USD |
| 10-27/09 | United States (North and South Carolina) | Hurricane Florence | 53 | 14 billion USD | 5 billion USD |
| 07-17/09 | China Hong Kong Philippines | Typhoon Mangkhut | 130 | 50 billion USD (Hong Kong and China) 16 to 20 billion USD (Philippines) (1) | 1 to 2 billion USD (insured losses in Chinese industry) 448 million USD (Hong Kong) |
| 23/07 | Greece (Attica) | Attic Fires | 92 | - | - |
| 28/06 - 08/07 | Japan (Shikoku) | Floods | 200 | 10 billion USD | 2.6 to 4 billion USD (2) |
| 28/09 | Indonesia (Sulawesi) | Earthquakes and tsunamis | 2 010 morts | 911 million USD | 51.3 million USD |
| 03/05 à aujourd’hui | United States (Hawaii) | Volcanic eruptions | - | 1 billion USD (3) | - |
(1) Bloomberg estimates
(2) Does not take into account business interruption following a disaster
(3) Estimates
Natural disasters in 2018 : number of events, victims and amount of economic and insurred losses
| 2018 | 2017 | Last 10-year average (2008-2017) | Last 30-year average (1988-2017) | |
| Number of events | 850 | 740 | 630 | 500 |
| Number of victims | 10 400 | 13 000 | 60 000 | 53 000 |
| Total economic losses in millions USD | 160 000 | 350 000 | 190 000 | 140 000 |
| Total insured losses in millions USD | 80 000 | 140 000 | 61 000 | 41 000 |
| % of insured losses | 50% | 40% | 32% | 29.3% |
Source : Munich Re