

- Date of creation: 1977 in Nairobi, Kenya
- Classes of business: Non-life, life, pension insurance and financial services
- Regional structures: 4 companies in Kenya, a subsidiary in Uganda and 12 local agencies
Apollo Group - Kenya in 2023
 |  |
Daniel Ndonye Chairman of the Board of Directors | Ashok Shah Group CEO |
Management
| Daniel Ndonye | Chairman of the Board of Directors |
| Ashok Shah | Group CEO |
| Dinpankar Acharya | CEO «APA Insurance Company» |
| John Kigochi | CFO «APA Insurance Company» |
| Parul Khimasia | COO «APA Insurance Company» |
| Eric Wanting | CEO «APA Life Assurance Company» |
| Daniel Mugo | CFO «APA Life Assurance Company» |
Shareholding
| Apollo Investments Limited | 100% |
Read also | Kenya insurance market
APA Insurance Company
 |
Dinpankar Acharya CEO APA Insurance Company |
Insurance revenue (IFRS 17) | 105 865 000 USD |
Share capital | 7 913 000 USD |
Assets | 125 522 000 USD |
Shareholder’s equity | 37 280 000 USD |
Net result | 5 866 000 USD |
Combined ratio (IFRS17) | 76.86% |
APA Insurance Company : main technical indicators (2019-2023)
Figures in thousands USD| Indicators | 2019 | 2020 | 2021 | 2022 | 2023 |
|---|---|---|---|---|---|
| IFRS 17 | |||||
| Insurance revenue | - | - | - | 111 010 | 105 865 |
| Insurance service expenses | - | - | - | 99 439 | 81 366 |
| Combined ratio (1) | - | - | - | 89.58% | 76.86% |
| IFRS 4 | |||||
| Gross written premiums | 91 318 | 86 531 | 93 302 | 117 972 | - |
| Net written premiums | 65 049 | 57 936 | 59 042 | 76 805 | - |
| Net earned premiums | 66 337 | 58 734 | 57 548 | 70 879 | - |
| Net incurred losses | 46 437 | 37 875 | 41 439 | 48 733 | - |
| Management expenses | 19 801 | 18 445 | 15 464 | 20 432 | - |
| Net loss ratio (2) | 70% | 64.49% | 72.01% | 68.76% | - |
| Net management expenses ratio (3) | 30.44% | 31.84% | 26.19% | 26.60% | - |
| Net combined ratio (4) | 100.44% | 96.33% | 98.20% | 95.36% | - |
| Net result | 7 533 | 4 221 | 4 852 | 4 572 | 5 866 |
(1) Combined ratio (IFRS 17) = Incurred losses / Insurance Revenue
(2) Net loss ratio = Net incurred losses / Net earned premiums
(3) Net management expenses ratio = Management expenses / Written premiums net of reinsurance
(4) Net combined ratio (IFRS 4) = Net loss ratio + Net management expenses ratio
Exchange rate as at 31/12/2023 : 1 KES = 0.00633 USD ; at 31/12/2022: 1 KES = 0.00805 USD; 31/12/2021: 1 KES = 0.00878 USD; at 31/12/2020 1 KES = 0.0091 USD; at 31/12/2019: 1 KES = 0.00978 USD
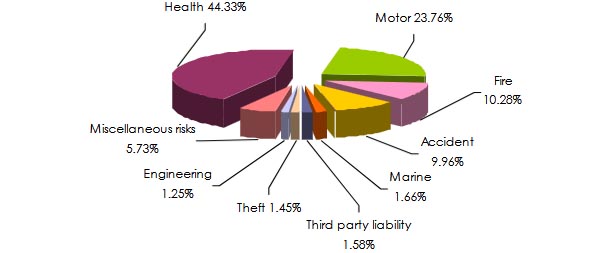
APA Insurance Company : breakdown of premiums and insurance revenue by class of business
Chiffres en milliers USD| Classes of business | 2019 | 2020 | 2021 | 2022 | 2023 | 2023 shares |
|---|---|---|---|---|---|---|
| Health | 36 090 | 32 212 | 33 716 | 43 411 | 46 935 | 44.33% |
| Motor | 29 339 | 25 827 | 24 921 | 30 347 | 25 154 | 23.76% |
| Fire | 8 223 | 8 056 | 9 411 | 12 121 | 10 878 | 10.28% |
| Accident (2) | 6 835 | 5 890 | 11 029 | 11 879 | 10 545 | 9.96% |
| Marine (3) | 2 128 | 3 219 | 4 000 | 2 465 | 1 761 | 1.66% |
| Third party liability | 1 337 | 1 308 | 1 557 | 1 908 | 1 670 | 1.58% |
| Theft | 2 144 | 1 917 | 1 848 | 1 974 | 1 534 | 1.45% |
| Engineering | 1 560 | 1 597 | 2 140 | 1 743 | 1 322 | 1.25% |
| Miscellaneous risks | 3 662 | 6 505 | 4 680 | 5 162 | 6 066 | 5.73% |
| Total | 91 318 | 86 531 | 93 302 | 111 010 | 105 865 | 100% |
(1) Gross premiums for 2019, 2020 and 2021. Insurance revenue for 2022 and 2023
(2) including personal accident and workmen's compensation
(3) Including marine transport and aviation
Breakdown of 2023 insurance revenue by class of business
APA Insurance Company : combined ratio by class of business (1) : 2019-2023
| Classes of business | 2019 | 2020 | 2021 | 2022 | 2023 |
|---|---|---|---|---|---|
| Health | 109.57% | 96.91% | 104.70% | 96.90% | 89.65% |
| Motor | 121.20% | 108.55% | 118.64% | 109.23% | 92.47% |
| Fire | 90.72% | 93.98% | 101.11% | 58.70% | 40.45% |
| Accident | 25.86% | 48.82% | 42.60% | 64.32% | 46.06% |
| Marine | 60.50% | 76.89% | 71.96% | 48.57% | 127.21% |
| Third party liability | -47.86% | 44.46% | 55.91% | 140.73% | 34.24% |
| Theft | 69.30% | 74.28% | 49.90% | 64.12% | 39.82% |
| Engineering | 106.88% | 98.67% | 110.14% | 67.04% | 110.05% |
| Miscellaneous risks | 84.16% | 109.78% | -21.25% | -178.02% | 31.25% |
| Total | 100.44% | 96.33% | 98.20% | 95.36% | 76.86% |
(1) Combined ratio according to IFRS 4 for 2019, 2020, 2021 and 2022 and according to IFRS 17 for 2023 Combined ratio under IFRS 4 = Loss ratio + Management expenses ratio
Combined ratio under IFRS 17 = Incurred losses / Insurance revenue
Sources: APA Insurance Company and IRA Kenya
APA Life Assurance Company
 |
Eric Wanting CEO APA Insurance Company |
Insurance revenue (IFRS 17) | 18 210 000 USD |
Share capital | 6 963 000 USD |
Assets | 82 636 000 USD |
Shareholder’s equity | 6 028 000 USD |
Net result | 1 149 000 USD |
APA Life Assurance Company : main technical indicators (2019-2023)
Figures in thousands USD| Indicators | 2019 | 2020 | 2021 | 2022 | 2023 |
|---|---|---|---|---|---|
| IFRS 17 | |||||
| Insurance revenue | - | - | - | 17 341 | 18 210 |
| Insurance Service Results | - | - | - | 2 315 | 5 851 |
| Net investment income | - | - | - | 6 650 | 8 262 |
| IFRS 4 | |||||
| Gross written premiums | 14 843 | 16 066 | 27 871 | 38 862 | |
| Net written premiums | 10 801 | 11 272 | 23 242 | 32 720 | |
| Net result | 832 | 588 | -1 610 | -829 | |
Exchange rate as at 31/12/2023 : 1 KES = 0.00633 USD ; at 31/12/2022: 1 KES = 0.00805 USD; 31/12/2021: 1 KES = 0.00878 USD; at 31/12/2020 1 KES = 0.0091 USD; at 31/12/2019: 1 KES = 0.00978 USD
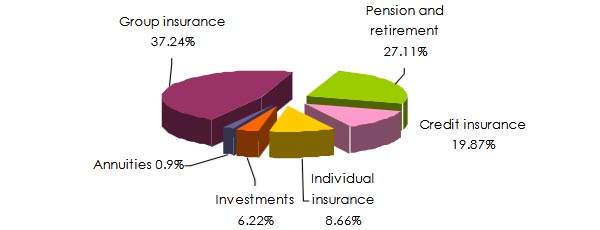
APA Life Assurance Company : breakdown of life turnover by class of business: 2019-2023 (IFRS 4)
Figures in thousands USD| Classes of business | 2019 | 2020 | 2021 | 2022 | 2023 | 2023 shares |
|---|---|---|---|---|---|---|
| Group insurance | 4 909 | 6 366 | 7 547 | 12 187 | 11 868 | 37.24% |
| Pension and retirement | 5 957 | 4 903 | 9 428 | 13 712 | 8 639 | 27.11% |
| Credit insurance | 2 276 | 1 927 | 5 335 | 6 018 | 6 334 | 19.87% |
| Individual insurance | 1 453 | 1 898 | 3 116 | 3 322 | 2 760 | 8.66% |
| Investments | 1 | 1 | - | 2 874 | 1 981 | 6.22% |
| Annuities | 247 | 971 | 2 445 | 749 | 288 | 0.90% |
| Total | 14 843 | 16 066 | 27 871 | 38 862 | 31 870 | 100% |
Breakdown of 2023 life turnover by class of business
Apollo Group - Kenya: Contact
| Head office | Apollo Center, Ring Rd Parklands Westlands Nairobi – Kenya |
| Phone | (020) 286 2000/364 1000 |
info@apainsurance.org | |
| Website |