The Japanese insurance market features
- Regulatory authority: The Financial Services Agency (FSA)
- Life and non-life premiums: 335.2 billion USD
- Insurance density: 2 679 USD
- Penetration rate: 7.87%
Structure of the Japanese insurance market
The Japanese insurance market | Total |
|---|---|
Non-life insurance companies | 47 |
Life insurance companies | 42 |
Non-life reinsurance companies | 8 |
Total | 97 |
* as at 31/03/2023
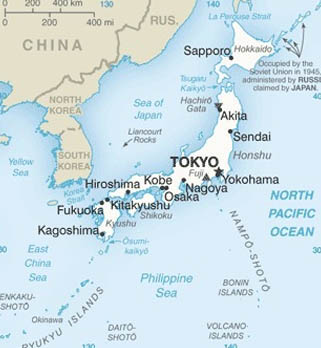
Profile
- Surface area (1): 377 972 km2
- Population (2) (2022): 125 124 989 inhabitants
- GDP (2) (2022): 4 260 billion USD
- GDP per capita (2) (2022) : 34 017 USD
- GDP growth rate (2) (2022): 1%
- Inflation rate (2) (2022): 2.5%
- Main sectors of activity: Automotive, electronics, semiconductors, iron and steel, petrochemicals, pharmaceuticals, biotechnologies, shipbuilding, aeronautics and agrifood.
(1) Source: Population.data
(2) Source: World Bank
Major cities (1)
(by number of inhabitants) (2024)
- Tokyo (capital) : 37 115 035
- Osaka : 18 967 459
- Nagoya : 9 556 879
(1) Source : Statisticstimes.com
The Japanese insurance market: evolution of premiums by life and non-life class of business (2018-2022)
Figures in millions USD| 2018 | 2019 | 2020 | 2021 | 2022 | |
|---|---|---|---|---|---|
Life | 305 913 | 291 180 | 264 817 | 244 557 | 260 107 |
Non-life | 84 914 | 89 654 | 87 320 | 79 301 | 75 093 |
Total | 390 827 | 380 834 | 352 137 | 323 858 | 335 200 |
Indicators as at 31 March. In Japan, the fiscal year begins on 1 April of year Y and ends on 31 March of Y+1.
Exchange rate as at 31/03/2023: 1 JPY = 0.00754 USD, at 31/03/2022: 1 JPY = 0.0082 USD, at 31/03/2021: 1 JPY = 0.00907 USD, at 31/03/2020: 1 JPY = 0.00927 USD, at 31/03/2019: 1 JPY = 0.00902 USD
The Japanese non-life insurance market indicators 2018-2022
Figures in millions USD| 2018 | 2019 | 2020 | 2021 | 2022 | 2021-2022 evolution (1) | |
|---|---|---|---|---|---|---|
| Gross premiums | 84 914 | 89 654 | 87 320 | 79 301 | 75 093 | 2.98% |
| Shareholder’s equity | 69 247 | 62 826 | 71 833 | 66 298 | 58 120 | -4.66% |
| Share capital | 7 065 | 6 740 | 6 640 | 6 105 | 5 542 | -1.28% |
| Total assets | 284 227 | 284 107 | 293 290 | 267 027 | 239 387 | -2.50% |
| Net result | 6 102 | 4 243 | 3 969 | 5 501 | 3 781 | -25.24% |
| Net loss ratio | 69.10% | 63.90% | 58.00% | 59.30% | 64.90% | 9.44% |
| Net combined ratio | 101.60% | 96.50% | 90.70% | 92.20% | 97.50% | 5.75% |
(1) Growth rate in local currency
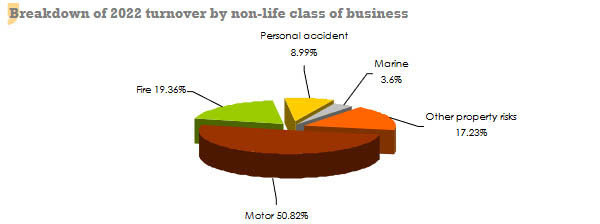
The Japanese insurance market: turnover by non-life class of business 2018-2022
Figures in millions USD| 2018 | 2019 | 2020 | 2021 | 2022 | 2022 shares | |
|---|---|---|---|---|---|---|
| Motor | 46 038 | 47 746 | 46 123 | 41 465 | 38 166 | 50.82% |
| Fire | 14 131 | 15 799 | 16 119 | 14 536 | 14 542 | 19.36% |
| Personal accident | 8 813 | 9 102 | 7 343 | 7 190 | 6 748 | 8.99% |
| Marine | 2 491 | 2 648 | 2 485 | 2 535 | 2 701 | 3.60% |
| Other property risks | 13 441 | 14 359 | 15 250 | 13 575 | 12 936 | 17.23% |
| Non-life total | 84 914 | 89 654 | 87 320 | 79 301 | 75 093 | 100% |
The Japanese insurance market: net premiums by non-life class of business 2018-2022
Figures in millions USD| 2018 | 2019 | 2020 | 2021 | 2022 | 2021-2022 evolution (1) | |
|---|---|---|---|---|---|---|
| Motor | 45 260 | 47 166 | 45 596 | 41 013 | 37 641 | -0.19% |
| Fire | 10 688 | 11 872 | 13 326 | 12 359 | 12 765 | 12.33% |
| Personal accident | 6 201 | 6 257 | 5 628 | 5 178 | 5 009 | 5.19% |
| Marine | 2 286 | 2 430 | 2 201 | 2 238 | 2 359 | 14.64% |
| Other property risks | 11 268 | 12 084 | 12 092 | 11 424 | 10 987 | 4.60% |
| Non-life total | 75 703 | 79 809 | 78 843 | 72 212 | 68 761 | 3.56% |
(1) Growth rate in local currency
The Japanese insurance market: paid losses by non-life class of business 2018-2022
Figures in millions USD| 2018 | 2019 | 2020 | 2021 | 2022 | 2021-2022 evolution (1) | |
|---|---|---|---|---|---|---|
| Motor | 27 363 | 27 882 | 24 194 | 21 713 | 21 439 | 7.38% |
| Fire | 17 430 | 15 134 | 10 968 | 13 387 | 9 721 | -21.03% |
| Personal accident | 3 105 | 3 180 | 2 748 | 2 467 | 2 954 | 30.23% |
| Marine | 1 721 | 1 583 | 1 228 | 1 246 | 1 097 | -4.27% |
| Other property risks | 6 282 | 7 227 | 7 194 | 1 674 | 6 309 | 309.91% |
| Non-life total | 55 901 | 55 006 | 46 332 | 40 487 | 41 520 | 11.53% |
(1) Growth rate in local currency
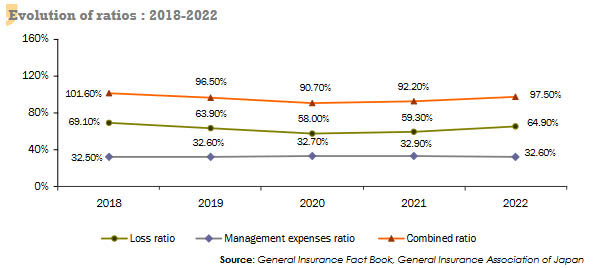
The Japanese insurance market: technical ratios
| 2018 | 2019 | 2020 | 2021 | 2022 | |
|---|---|---|---|---|---|
| Loss ratio | 69.10% | 63.90% | 58.00% | 59.30% | 64.90% |
| Management expenses ratio | 32.50% | 32.60% | 32.70% | 32.90% | 32.60% |
| Combined ratio | 101.60% | 96.50% | 90.70% | 92.20% | 97.50% |
The Japanese insurance market: key life insurance market indicators 2018-2022
Figures in millions USD| 2018 | 2019 | 2020 | 2021 | 2022 | 2021-2022 evolution (1) | |
|---|---|---|---|---|---|---|
| Gross premiums | 305 913 | 291 180 | 264 817 | 244 557 | 260 107 | 15.67% |
| Shareholder’s equity | - | 109 201 | 104 296 | 102 574 | 94 062 | 4.00% |
| Share capital | - | 24 649 | 23 845 | 22 009 | 19 212 | -5.07% |
| Total assets | 3 497 902 | 3 640 653 | 3 740 885 | 3 441 507 | 3 067 385 | -3.07% |
| Net result | 34 014 | 34 002 | 35 210 | 35 326 | 20 592 | -36.61% |
(1) Growth rate in local currency
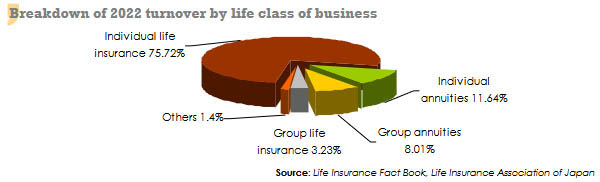
The Japanese insurance market: turnover by life class of business 2018-2022
Figures in millions USD| 2018 | 2019 | 2020 | 2021 | 2022 | 2022 shares | |
|---|---|---|---|---|---|---|
| Individual life insurance | 227 800 | 218 373 | 198 561 | 182 827 | 196 952 | 75.72% |
| Individual annuities | 34 952 | 30 591 | 27 999 | 26 962 | 30 273 | 11.64% |
| Group annuities | 25 806 | 26 262 | 23 119 | 21 386 | 20 841 | 8.01% |
| Group life insurance | 9 886 | 9 697 | 9 714 | 8 962 | 8 392 | 3.23% |
| Others | 7 469 | 6 257 | 5 424 | 4 420 | 3 649 | 1.40% |
| Life total | 305 913 | 291 180 | 264 817 | 244 557 | 260 107 | 100% |