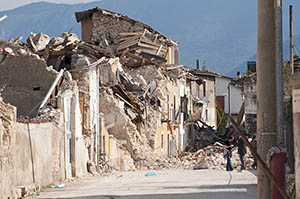
Natural disasters: annual report for the period 2003-2022
Figures in millions USD
| 1 | 2 | 3 | 4 | % 4/3 | |
|---|---|---|---|---|---|
| Number of events | Number of victims | Economic losses (1) | Insured losses (1) | ||
| 2022 | 187 | 32 600 | 275 000 | 125 000 | 45.45% |
| 2021 | 170 | 8 200 | 270 000 | 111 000 | 41.10% |
| 2020 | 190 | 5 820 | 217 000 | 89 540 | 41.30% |
| 2019 | 204 | 8 419 | 145 380 | 56 690 | 39.00% |
| 2018 | 181 | 9 812 | 179 800 | 89 740 | 49.90% |
| 2017 | 188 | 8 576 | 370 000 | 154 040 | 41.60% |
| 2016 | 196 | 6 856 | 187 330 | 52 340 | 27.90% |
| 2015 | 199 | 19 539 | 93 040 | 31 710 | 34.10% |
| 2014 | 192 | 7 018 | 115 840 | 33 110 | 28.60% |
| 2013 | 169 | 21 359 | 144 240 | 42 460 | 29.40% |
| 2012 | 175 | 8 955 | 205 890 | 77 620 | 37.70% |
| 2011 | 181 | 28 279 | 478 700 | 145 220 | 30.30% |
| 2010 | 191 | 297 651 | 256 230 | 56 590 | 22.10% |
| 2009 | 145 | 8 922 | 78 410 | 28 760 | 36.70% |
| 2008 | 151 | 234 882 | 313 330 | 55 610 | 17.70% |
| 2007 | 153 | 15 248 | 88 600 | 31 620 | 35.70% |
| 2006 | 147 | 23 751 | 64 310 | 17 720 | 27.60% |
| 2005 | 164 | 92 591 | 326 140 | 142 000 | 43.50% |
| 2004 | 126 | 235 180 | 201 470 | 67 120 | 33.30% |
| 2003 | 160 | 72 489 | 106 740 | 26 650 | 25.00% |
(1) Economic and insured losses as of the date of publication of each year's annual natural catastrophe report
Source : Swiss Re Institute

0
Your rating: None
Wed, 17/05/2023 - 10:43
The online magazine
Live coverage
16:28
16:04
11:51
04/24
04/24
Latest news