Saudi Arabia 2008
Turnover's evolution 2005-2008
in thousands USD| 2005 | 2006 | 2007 | 2008 | ||||||
|---|---|---|---|---|---|---|---|---|---|
| Written premiums | Shares in % | Written premiums | Shares in % | Written premiums | Shares in % | Written premiums | Shares in % | 2007-2008 evolution | |
| Non life | |||||||||
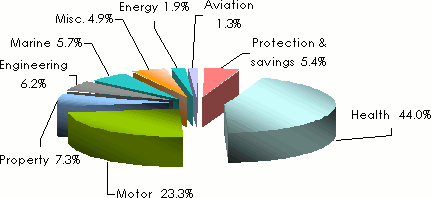
Motor | 423 301 | 30.8 | 512 078 | 27.7 | 652 070 | 28.4 | 677 597 | 23.3 | 4.2% |
Property | 171 609 | 12.5 | 205 130 | 11.1 | 198 331 | 8.7 | 212 814 | 7.3 | 7.6% |
Engineering | 9 044 | 5.8 | 144 993 | 7.8 | 128 185 | 5.6 | 181 814 | 6.2 | 42.2% |
Marine | 101 872 | 7.4 | 115 045 | 6.2 | 142 054 | 6.2 | 165 154 | 5.7 | 16.6% |
Miscellaneous1 | 113 072 | 8.2 | 154 567 | 8.4 | 154 266 | 6.7 | 141 618 | 4.9 | -8% |
Energy | 32 428 | 2.4 | 33 788 | 1.8 | 81 582 | 3.6 | 55 496 | 1.9 | -31.8% |
Aviation | 36 028 | 2.6 | 33 628 | 1.8 | 30 596 | 1.3 | 36 917 | 1.3 | 21.0% |
Non life total | 957 354 | 69.7 | 1 199 229 | 64.8 | 1 387 085 | 60.5 | 1 471 410 | 50.6 | 6.3% |
Life | |||||||||
Health | 365 432 | 26.6 | 592 616 | 32.1 | 819 029 | 35.7 | 1 280 826 | 44 | 56.8% |
Protection&savings | 51 523 | 3.7 | 58 110 | 3.1 | 87 381 | 3.8 | 158 251 | 5.4 | 81.6% |
Grand total | 1 374 309 | 100 | 1 849 955 | 100 | 2 293 495 | 100 | 2 910 487 | 100 | 27.2% |
Written premiums' breakdown by class of business in 2008
Evolution 2005-2008
| 2005 | 2006 | 2007 | 2008 | |
|---|---|---|---|---|
| Penetration rate (in %) | ||||
Non life | 0.3 | 0.34 | 0.37 | 0.31 |
Health | 0.1 | 0.17 | 0.22 | 0.27 |
Protection & savings | 0.02 | 0.02 | 0.02 | 0.03 |
Total | 0.4 | 0.53 | 0.61 | 0.62 |
| Insurance density (in USD) | ||||
Non life | 41.4 | 50.6 | 57.9 | 59.3 |
Health | 15.8 | 25 | 34.2 | 51.6 |
Protection & savings | 2.3 | 2.5 | 3.5 | 6.4 |
Total | 59.5 | 78.1 | 95.6 | 117.3 |
| Retention ratio (in %)1 | ||||
Accident & liabilities | 43.1 | 42 | 38 | 40.9 |
Motor | 93.7 | 94.5 | 94.1 | 96.7 |
Property | 10.8 | 10.5 | 11.3 | 11.9 |
Marine | 29.5 | 28.8 | 31.9 | 32.5 |
Aviation | 2.9 | 3.4 | 3.1 | 4 |
Energy | 0.1 | 0 | 0.8 | 0.4 |
Engineering | 19.2 | 15.5 | 20.3 | 17.9 |
Non life total | 53.3 | 52.3 | 55.4 | 56.2 |
Health | 80.8 | 82.9 | 78.4 | 78 |
Average | 60.9 | 62.4 | 64.6 | 67 |
Written premiums' evolution by class of business 2005 - 2008
in thousands USD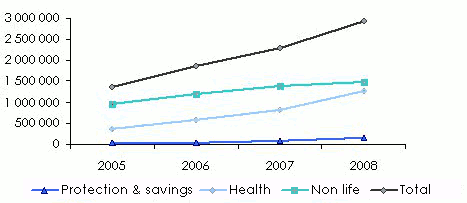
Exchange rate SR/USD as at 31/12 | 2005 | 2006 | 2007 | 2008 |
0.26668 | 0.26668 | 0.26722 | 0.26655 |