South Africa, a world-class giant among others
The beginnings of South African insurance date back to 1831 when the first company, South African Fire & Life Assurance, was set up. Nearly 60 years later, branches of British insurers established their own companies in the country. In 1894, South African Fire & Life Assurance was then taken over by the London & Lancaster Insurance Company. In 1918, Santam, the current leader of the non life market was founded in Cape Town.
With the increasing number of players, the legislation had developed. In 1943, a new law set a 30% minimum shareholding for South African investors in the capital of insurance companies, which prompted foreign companies to set up local entities. In 1970 another major player entered the market, Mutual and Federal, resulting from the merger of Royal Insurance Group and South African Mutual Fire and General Insurance. This group became the second non life insurer in the country in terms of premiums.
In 1990, the regulators set up a new insurance regulatory body, the Financial Services Board (FSB).
An important market with a penetration rate among the highest worldwide
 © Dylan Harbour, CC BY-SA 3.0South Africa has only 50.8 million inhabitants. But despite this relatively low figure, the finance sector is highly developed. In 2012, the country ranked 17th worldwide in the insurance sector with a total premium volume of 51.9 billion USD, far ahead of all other countries on the continent.
South Africa alone accounts for 72.27% of the premiums collected in 2012 in Africa. The level of financial sector development gives people easy access to insurance.
Position of South Africa worldwide in 2012
in millions USD| South Africa | Rest of Africa | Total Africa | %South Africa/Africa | Total World premiums | % South Africa/World | |
|---|---|---|---|---|---|---|
Life | 41 691 | 8 197 | 49 888 | 83.57% | 2 620 864 | 1.59% |
Non life | 10 269 | 11 733 | 22 002 | 46.67% | 1 991 650 | 0.51% |
Total | 51 959 | 19 931 | 71 890 | 72.27% | 4 612 514 | 1.13% |
Penetration rate
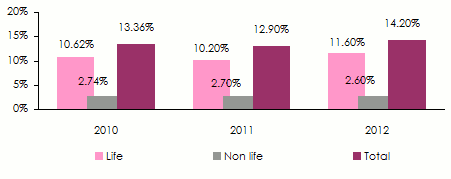
Penetration rate was 14.16% in 2012, not only the most important in Africa but also among the highest in the world. Life insurance dominates the market since its penetration rate reached 11.56% compared to 2.6% in non life.
While the country has sophisticated insurance products, it still has to exert important efforts before it
can appeal to low-income people. Microinsurance is not actually present in South Africa due to the absence of legislation in this area. Only death insurance policies are provided in this niche. A draft law governing microinsurance is likely to be promulgated during 2014. Unconventional distribution channels ought to be created to attract the have-nots.
Evolution of penetration rate: 2010-2012
 Source: Sigma
 The first 10 penetration rates in 2012
| Life | Non life | Total | |
|---|---|---|---|
Taïwan | 15 | 3.2 | 18.2 |
South Africa | 11.6 | 2.6 | 14.2 |
Netherlands | 3.8 | 9.2 | 13 |
Hong Kong | 11 | 1.4 | 12.4 |
South Korea | 6.9 | 5.3 | 12.2 |
Japan | 9.2 | 2.3 | 11.5 |
United Kingdom | 8.4 | 2.8 | 11.2 |
Finland | 8.4 | 2 | 10.4 |
Switzerland | 5.2 | 4.3 | 9.5 |
Denmark | 6.6 | 2.8 | 9.4 |
World average | 3.7 | 2.8 | 6.5 |
Insurance density in 2012
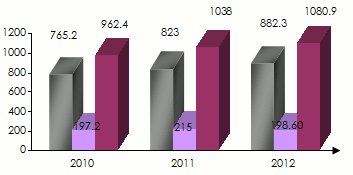
In 2012, insurance density amounted to 1080.9 USD per capita among which 882.3 USD in life and 198.6 USD in non life insurance.
Evolution of density: 2010-2012
 Source: Sigma
 Insurance density: position of South Africa in 2012
in USD| Life | Non life | Total | |
|---|---|---|---|
Switzerland | 4121 | 3401 | 7522 |
Netherlands | 1750 | 4235 | 5985 |
Denmark | 3718 | 1586 | 5304 |
Japan | 4143 | 1025 | 5168 |
Luxembourg | 3067 | 2012 | 5079 |
Finland | 3860 | 910 | 4770 |
Hong Kong | 4025 | 519 | 4544 |
Norway | 2831 | 1656 | 4487 |
United Kingdom | 3256 | 1094 | 4350 |
United States | 1808 | 2239 | 4047 |
Ireland | 3068 | 944 | 4012 |
Sweden | 2866 | 1030 | 3896 |
Taiwan | 3107 | 653 | 3760 |
Belgium | 2367 | 1208 | 3575 |
France | 2239 | 1304 | 3543 |
Canada | 1493 | 2040 | 3533 |
Singapore | 2472 | 890 | 3362 |
Germany | 1299 | 1505 | 2804 |
South Korea | 1578 | 1207 | 2785 |
Austria | 991 | 1488 | 2479 |
Italy | 1473 | 748 | 2221 |
Spain | 730 | 827 | 1557 |
Israel | 808 | 698 | 1506 |
United Arab Emirates | 294 | 1170 | 1464 |
Portugal | 794 | 485 | 1279 |
Slovenia | 339 | 908 | 1247 |
Macau | 825 | 364 | 1189 |
Cyprus | 509 | 669 | 1178 |
South Africa | 882 | 199 | 1081 |
Malta | 655 | 335 | 990 |
World average | 373 | 283 | 656 |
Role of supervisory and regulatory authorities
Insurance control and regulation has been entrusted to the Financial Services Board (FSB) which oversees the entire sector, with the exception of health insurance.
 Nelson Mandela bridge © austinevan, CC BY 2.0 Nelson Mandela bridge © austinevan, CC BY 2.0 |
Most prudential rules applied in developed countries are also in force in South Africa, and so are accounting and auditing standards. The country has ordered the monitoring of IFRS (International Financial Reporting) standards as of 2005.
Today the FSB is examining the establishment, in 2016, of new accounting rules called Solvency Assessment and Management (SAM), outlining the quantitative and qualitative requirements while demanding more transparency in the presentation of financial results. The SAM project is drawing direct inspiration from the Solvency II rules.
The authorities have also considered a bipolar supervision system with the Central Bank monitoring compliance with macro prudential rules, and FSB regulating market practice.
Structure of the current insurance market
By March 31st 2013, 175 direct insurance companies have their license among whom 77 in life business and 98 in non life. The market counts also 15 reinsurers, 8 in non life and 7 in life.
Number and type of life insurance company
Type of insurer | 2012 | 2013 |
|---|---|---|
| Insurers | ||
Traditional insurer | 31 | 32 |
Niche insurer | 10 | 10 |
Linked insurer1 | 15 | 15 |
Cell captive insurer2 | 7 | 7 |
Assistance | 10 | 7 |
Insurer in run-off | 7 | 6 |
| Reinsurers | ||
Life reinsurer | 3 | 3 |
Life and non life reinsurer | 4 | 4 |
Total | 87 | 84 |
2 Alternative system of «rent-a-captive», specific to South African market Source: FSB
Number and type of non life insurance company
Type of insurer | 2012 | 2013 |
|---|---|---|
| Insurers | ||
Traditional insurer | 31 | 33 |
Niche insurer | 31 | 31 |
Cell captive insurer 1 | 10 | 8 |
Captive insurer | 11 | 10 |
Insurer in run-off | 15 | 16 |
| Reinsurers | ||
Non life reinsurer | 4 | 4 |
Life and non life reinsurer | 4 | 4 |
Total | 106 | 106 |
The market of life and non life insurance
The South African market has quickly recovered from the global economic crisis. By December 31, 2012, the total market turnover amounted to 440.222 billion ZAR (51.959 billion USD).
The sector is dominated by life insurance which accounts for almost 80% of all market contributions, that is 353.223 billion ZAR (41.690 billion USD) in 2012.
Non life insurance reported a premium volume of 86.999 billion ZAR (10.268 billion USD), compared to 79.407 billion ZAR (9.782 billion USD) in 2011, that is an increase of 9%.
Breakdown of gross life and non life premiums in 2012
in thousands USD| 2012 premiums in ZAR | 2012 premiums in USD | Market share | |
|---|---|---|---|
Non life | 86 999 506 | 10 268 552 | 19.76% |
Life | 353 223 090 | 41 690 921 | 80.24% |
Total life and non life market | 440 222 596 | 51 959 473 | 100% |
Life insurance
Market share and gross written premiums of the first 10 life insurers in 2012
By December 31, 2012, the top ten life insurers control more than 75% of the market premiums.
in thousands USD| 2012 premiums in ZAR | 2012 premiums in USD | Market share | |
|---|---|---|---|
Old Mutual | 55 535 587 | 6 554 865 | 15.72% |
Momentum Group | 36 090 178 | 4 259 724 | 10.22% |
Sanlam | 35 134 669 | 4 146 945 | 9.95% |
Investec | 33 148 080 | 3 912 468 | 9.38% |
Liberty Group | 29 860 060 | 3 524 383 | 8.45% |
Coronation Life | 23 679 513 | 2 794 893 | 6.71% |
Investment Solutions | 23 555 874 | 2 780 300 | 6.67% |
Alexander Forbes | 10 280 818 | 1 213 445 | 2.91% |
Allan Gray Life | 10 245 789 | 1 209 310 | 2.90% |
Discovery Life | 10 228 629 | 1 207 285 | 2.89% |
Total top 10 insurers | 267 759 197 | 31 603 618 | 75.80% |
Rest of the market | 85 463 893 | 10 087 303 | 24.20% |
Total life market | 353 223 090 | 41 690 921 | 100% |
Net life premiums split per class of business
In life insurance, life and pension policies account for almost all market underwritings with over 93% of premium income.
in thousands USD| Net premiums in ZAR | Net premiums in USD | Market share | |
|---|---|---|---|
Assistance* | 5 550 024 | 655 069 | 1.71% |
Disability | 5 425 832 | 640 411 | 1.67% |
Pension | 152 070 010 | 17 948 823 | 46.85% |
Health | 3 757 541 | 443 503 | 1.15% |
Life | 149 969 151 | 17 700 859 | 46.20% |
Sinking fund | 7 843 900 | 925 816 | 2.42% |
Total | 324 616 458 | 38 314 481 | 100% |
Non life insurance
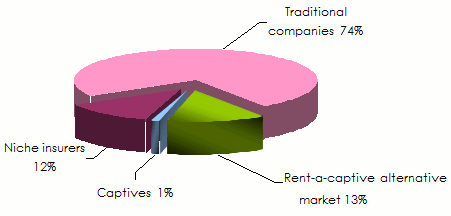
74% of the non life operations are carried out by traditional insurance companies. Niche insurers and the various captives along with similar entities are reporting 26% of the overall non life turnover in 2012.
 Source: FSB
 Market share and gross written premiums of the first 10 non life insurers in 2012
Despite the high number of players, the insurance industry remains largely concentrated in the hands of a few big companies which dominate the market. By December 31, 2012, the top ten non life insurers have accounted for more than 63% of the overall premiums.
| 2012 premiums in ZAR | 2012 premiums in USD | Market share | |
|---|---|---|---|
Santam | 16 527 094 | 1 950 693 | 19.00% |
Mutual & Federal | 7 537 799 | 889 686 | 8.66% |
Hollard | 5 566 673 | 657 034 | 6.40% |
Guardrisk | 5 498 070 | 648 937 | 6.32% |
OUTsurance | 5 340 678 | 630 360 | 6.14% |
Absa | 3 426 990 | 404 488 | 3.94% |
Zurich | 3 403 040 | 401 661 | 3.91% |
Auto&General | 3 152 661 | 372 109 | 3.62% |
Allianz Global | 2 469 679 | 291 496 | 2.84% |
Centriq | 2 208 404 | 260 658 | 2.54% |
Total top 10 insurers | 55 131 088 | 6 507 122 | 63.37% |
Rest of the market | 31 868 418 | 3 761 429 | 36.63% |
Total non life market | 86 999 506 | 10 268 552 | 100% |
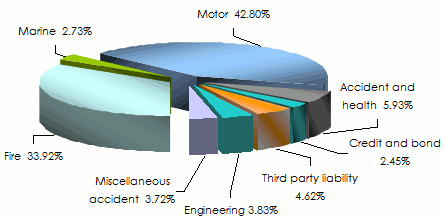
Breakdown of non life premiums per class of business in 2012
Motor and fire insurance account for 76.72% of premium income while other non life classes of business are lagging behind. This is the case for engineering and third party liability which respectively represent 3.83% and 4.62% of revenues. Marine insurance remains marginal with just 2.73%.
in thousands USD| 2012 premiums in ZAR | 2012 premiums in USD | Market share | |
|---|---|---|---|
Fire | 29 509 570 | 3 483 015 | 33.92% |
Marine | 2 373 175 | 280 106 | 2.73% |
Motor | 37 233 281 | 4 394 644 | 42.80% |
Accident & Health | 5 161 345 | 609 194 | 5.93% |
Credit, bond | 2 136 496 | 252 171 | 2.45% |
Third party liability | 4 022 323 | 474 755 | 4.62% |
Engineering | 3 330 665 | 393 118 | 3.83% |
Miscellaneous accident | 3 232 651 | 381 550 | 3.72% |
Total non Life | 86 999 506 | 10 268 552 | 100% |
 Source: FSB
 Reinsurance market in 2012
In non life reinsurance, seven companies were locally registered at the end of 2012. They are: Africa Re, Flagstone Re, General Re, Hannover Re, Munich Re, Saxum Re and Scor Africa. Saxum Re is the only South African reinsurance company while the other companies are subsidiaries belonging to foreign groups established in South Africa.
Breakdown of non life reinsurance premiums per company
in thousands USD| Premiums 2012 | Fire in % | Marine in % | Motor in % | Accident & Health in % | Credit in % | TPL in % | Engineering in % | Misc. accident in % | |
|---|---|---|---|---|---|---|---|---|---|
Africa Re | 199 790 | 20.18% | 24.45% | 32.06% | 32.44% | 11.94% | 26.33% | 18.13% | 1.74% |
Flagstone Re | 4 633 | 0.39% | -0.94% | 0.61% | -0.68% | 0.10% | 0.03% | 2.59% | - |
General Re | 5 389 | 1.03% | 0.22% | 0.29% | 0.02% | - | 0.37% | 0.02% | - |
Hannover Re | 264 578 | 32. 95% | 22.48% | 35.56% | 12.55% | 26.90% | 31.38% | 9.16% | 8.35% |
Munich Re | 328 793 | 34.52% | 49.31% | 28.62% | 42.32% | 36.84% | 39.88% | 57.34% | 74.40 |
Saxum Re | -2.59 | - | - | - | - | - | - | - | -0.01% |
Scor Africa | 81 508 | 10.93% | 4.48% | 2.86% | 13.35% | 24.22% | 2.01% | 12.76% | 15.52% |
Total | 884 689 | 100% | 100% | 100% | 100% | 100% | 100% | 100% | 100% |
Insurance distribution channels
 Central Business District, Johannesburg © PZFUN, CC BY-SA 3.0 Central Business District, Johannesburg © PZFUN, CC BY-SA 3.0 |
The insurance market is endowed with a wide range of distribution channels, with intermediaries in control of most corporate risks. Brokers control a substantial share of the market even though banks are playing an important role in life insurance and direct sales are prospering. Brokers are everywhere setting their foot on the marine, third party liability, fire and motor markets.
South African brokerage has visibly changed during recent years: AON South Africa has acquired Glenrand MIB in April 2011 while Marsh took control of Alexander Forbes in August of the same year. Jardine Lloyd Thompson Group has obtained license in April 2011.
Mobile phones, call centers and internet are holding a more and more active position in direct sale. Bancassurance is also gathering momentum, getting more engaged in niche markets.
It is worth noting that insurance agents’ position is marginal with a penetration rate peaking at 7% in motor.
Distribution channels’ shares in insurance classes of business
| Insurance agents % | Brokers % | Direct business % | |
|---|---|---|---|
Fire | 5 | 82 | 13 |
Third party liability | 5 | 90 | 5 |
Motor | 7 | 78 | 15 |
Life insurance | 5 | 45 | 50 |
Marine | - | 95 | 5 |
The remuneration of intermediaries, based on premium percentage, is determined by the insurance commission which sets a maximum rate. Reductions are often granted by brokers, especially in times of stiff competition.
| Classes of business | Commissions in % of premiums |
|---|---|
Fire | Maximum 20% |
Third party liability | Maximum 20% |
Motor | Maximum 20% |
Accident | 12% |
Highly capitalized insurers are making profits
Operating results of insurance companies have been on the rise since the 1990s and positive as of 2001. Following the 2004 peak, these profits remain stable since 2005.
All South African insurers are posting a consolidated (operational + financial) profit in the last 24 years. Such profits have grown even bigger over the last ten years, as shown by the following chart which features results’ evolution since 1990:
 Source: FSB
 While operating results are good, they remain, nonetheless, exposed to the volatility of the local currency. The devaluation of the rand in relation with main international currencies has triggered an increase in claim costs, especially for the motor insurance because of the obligation to import spare parts from abroad. Moreover, climate factors, which we cannot exclude in this region of the world, may annihilate profits accumulated for several years.
In life insurance, overexposure of investments on stock markets (over 60% of assets detained in equity shares invested in listed companies) is likely to make insurers entirely dependent on financial markets.
The main external challenges insurers have to meet are summed up as follows:
| In life insurance |
|---|
|
| In non life insurance |
|---|
|
Capitalization ratio
Insurers’ soundness, as reflected by the excellent financial results so far, has allowed for the consolidation of the general outcome. By December 31, 2012, capitalization ratio (solvency margin) of most insurers had been two to five times above the minimum level required by the authorities.
| Number of life insurance companies | |||
|---|---|---|---|
Asset exceeding solvability margin | 2010 | 2011 | 2012 |
from 0-1 time | 3 | 2 | 0 |
from 1-2 times | 22 | 28 | 28 |
from 2-5 times | 37 | 35 | 31 |
from 5-10 times | 11 | 12 | 16 |
More than 10 times | 3 | 2 | 2 |
Total | 76 | 79 | 77 |