The Singaporian insurance market

Insurance market features
- Regulatory authority: Ministry of economy and finance
- Premiums (2005): 10 387 million USD
- Insurance density (2005): 1 983 USD
- Penetration rate (2005): 7.47%
Market structure in 2006
- Life companies: 7
- Non life companies: 100
- Composite companies: 7
- Reinsurance companies: 31
Identity
- Area: 647.8 Km2
- Population (2006): 4 492 000 inhabitants
- GDP (2006): 132.2 billion USD
- GDP per capita (2006): 29 429 USD
- GDP growth rate (2006): 7.9%
- Inflation rate (2006): 1%
- Main economic sectors: industry, construction, transport, communication, services
Major cities
(in number of inhabitants)
- Singapore (capital): 900 000
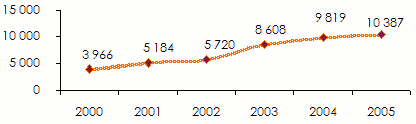
Turnover evolution: 2000-2005
in millions USD| Written premiums | 2000 | 2001 | 2002 | 2003 | 2004 | 2005 | 2004/05 growth rate |
|---|---|---|---|---|---|---|---|
Non life | 1 024 | 2 270 | 2 694 | 3 024 | 3 108 | 3 211 | 3.81% |
Life | 2 942 | 2 914 | 3 026 | 5 584 | 6 711 | 7 176 | |
Total | 3 966 | 5 184 | 5 270 | 8 608 | 9 819 | 10 387 |
Breakdown of non-life premiums: 2000-2005
in millions USD| Classes | 2000 | 2001 | 2002 | 2003 | 2004 | 2005 |
|---|---|---|---|---|---|---|
| Local market | ||||||
Motor | 286 | 292 | 371 | 413 | 417 | 410 |
Workmen's Compensation | 69 | 67 | 85 | 93 | 94 | 96 |
Fire | 117 | 129 | 185 | 196 | 195 | 198 |
Marine | 132 | 166 | 229 | 218 | 232 | 228 |
Miscellaneous | 333 | 353 | 466 | 508 | 439 | 482 |
Total | 937 | 1 007 | 1 336 | 1 428 | 1 377 | 1 414 |
| Offshore market | ||||||
Marine | 136 | 131 | 248 | 196 | 216 | 255 |
Property | 490 | 599 | 816 | 885 | 982 | 1 085 |
Miscellaneous | 326 | 385 | 479 | 512 | 532 | 458 |
Total | 952 | 1 115 | 1 543 | 1 593 | 1 730 | 1798 |
Loss ratio: 2000-2005
| Classes | 2000 | 2001 | 2002 | 2003 | 2004 | 2005 |
|---|---|---|---|---|---|---|
| Local market | ||||||
Fire | 28.5% | 28.1% | 28% | 33.3% | 31.8% | 34.1% |
Marine | 90.6% | 86.1% | 47.2% | 60.4% | 40.4% | 36% |
Motor | 19.3% | 92% | 91% | 81.6% | 69.5% | 63.6% |
Workmen's Compensation | 82.1% | 84.6% | 104.1% | 83.9% | 81.8% | 95.2% |
Miscellaneous | 10.5% | 60.1% | 52.7% | 39.5% | 49.6% | 47.9% |
Total | 78.7% | 68.7% | 66.1% | 58.4% | 56.3% | 53.6% |
| Offshore market | ||||||
Marine | NA | NA | NA | NA | NA | NA |
Property | 58.7% | 94.2% | 56.4% | 56.7% | 69.2% | 50.1% |
Miscellaneous | 72.8% | 66% | 66% | 59.1% | 55.7% | 56.8% |
Total | 66.4% | 81.7% | 59.9% | 60.3% | 64.2% | 52.9% |
Exchange rate USD/SGD as at 31/12 | 2000 | 2001 | 2002 | 2003 | 2004 | 2005 |
1.73 | 1.85 | 1.73 | 1.70 | 1.63 | 1.66 |