Hollard Insurance Group

- Date of creation: 1980, Johannesburg, South Africa
- Classes of business: Life, non-life and investments
- Rating: GCR / AA(za) / Stable
- Regional structures: 5 main subsidiaries (The Hollard Insurance Company, Hollard Life Assurance Company, Hollard Specialist Insurance, Hollard Specialist Life and Hollard Investment Managers), operating in 18 countries.
- Workforce: More than 4000 employees
Hollard Insurance Group in 2022
|


Management
| Adrian Dominic t’Hooft Enthoven | Chairman of the Board of Directors |
| Willie Lategan | Group CEO |
| Dirk Viljoen | Group CFO |
Shareholding
| Actionnaire | Share |
| Hollard Fundco (RF) (Proprietary) | 100% |
Hollard Group's main insurance companies in 2022
Figures in thousands USD
| Date of creation | Activity | Turnover | Shareholder’s equity | Net result | |
| The Hollard Insurance Company | 1980 | Non vie | 825 837 | 190 954 | 49 904 |
| Hollard Life Assurance Company | 1980 | Vie | 433 901 | 67 882 | 3 032 |
| Hollard Specialist Insurance | 1980 | Non vie | 61 655 | 30 405 | 12 058 |
| Hollard Specialist Life | 1980 | Vie | 42 138 | 55 835 | 10 117 |
Hollard Insurance Company as at 30 June 2022
| Share capital | 101 628 000 USD |
| Turnover | 825 837 000 USD |
| Assets | 1 050 813 000 USD |
| Shareholder’s equity | 190 954 000 USD |
| Net result | 49 904 000 USD |
| Net non-life loss ratio | 56,7% |
| Net non-life management expenses ratio | 38,5% |
| Net non-life combined ratio | 95,2% |
Hollard Insurance Company : main technical highlights
Figures in thousands USD
| Highlights | 2018 | 2019 | 2020 | 2021 | 2022 |
| Gross written premiums | 812 948 | 801 860 | 677 509 | 843 285 | 825 837 |
| Net written premiums | 619 357 | 624 192 | 512 561 | 582 765 | 552 565 |
| Net earned premiums | 613 891 | 599 129 | 507 708 | 579 908 | 534 832 |
| Net incurred losses | 334 941 | 317 788 | 267 180 | 340 491 | 303 247 |
| Management expenses | 284 247 | 263 520 | 231 550 | 243 636 | 212 755 |
| Net non-life loss ratio (1) | 54.56% | 53.04% | 52.62% | 58.71% | 56.70% |
| Net non-life management expenses ratio (2) | 45.89% | 42.22% | 45.18% | 41.81% | 38.50% |
| Net non-life combined ratio (3) | 100.45% | 95.26% | 97.80% | 100.52% | 95.20% |
| Net result | 22 352 | 42 666 | 22 085 | 27 768 | 49 904 |
(1) Net non-life loss ratio = Net non-life incurred losses / Net non-life earned premiums
(2) Net non-life management expenses ratio = Non-life management expenses/ Net non-life written premiums
(3) Net non-life combined ratio = Net non-life loss ratio+ Net non-life management expenses ratio
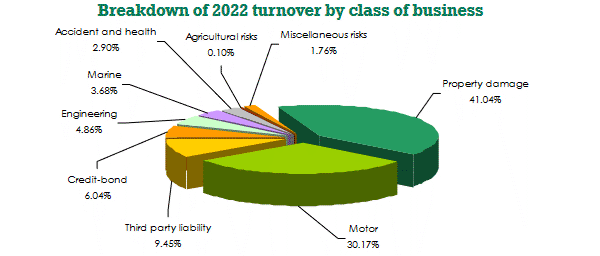
Hollard Insurance Company : breakdown of turnover by class of business
Figures in thousands USD
| 2018 | 2019 | 2020 | 2021 | 2022 | 2022 shares | |
| Property damage | 260 120 | 272 731 | 231 136 | 306 516 | 338 901 | 41.04% |
| Motor | 365 440 | 326 205 | 248 966 | 277 858 | 249 197 | 30.17% |
| Third party liability | 39 434 | 47 895 | 52 134 | 75 881 | 78 023 | 9.45% |
| Credit-bond | 4 615 | 58 496 | 45 951 | 57 481 | 49 847 | 6.04% |
| Engineering | 44 251 | 39 506 | 42 025 | 52 652 | 40 123 | 4.86% |
| Marine | 29 750 | 28 511 | 24 687 | 30 336 | 30 431 | 3.68% |
| Accident and health | 36 349 | 12 721 | 18 485 | 23 230 | 23 951 | 2.90% |
| Agricultural risks | - | 687 | 708 | 2 116 | 847 | 0.10% |
| Miscellaneous risks | 32 989 | 15 108 | 13 417 | 17 215 | 14 517 | 1.76% |
| Total | 812 948 | 801 860 | 677 509 | 843 285 | 825 837 | 100% |
Hollard Life Assurance Company as at 30 June 2022
| Share capital | 1 237 000 USD |
| Turnover | 433 901 000 USD |
| Assets | 2 153 769 000 USD |
| Shareholder’s equity | 67 882 000 USD |
| Net result | 3 032 000 USD |
Hollard Life Assurance Company : main technical highlights
Figures in thousands USD
| 2018 | 2019 | 2020 | 2021 | 2022 | |
| Gross written premiums | 472 523 | 476 424 | 401 576 | 478 577 | 433 901 |
| Net written premiums | 362 928 | 355 762 | 307 158 | 370 935 | 327 584 |
| Net earned premiums | 362 928 | 355 762 | 306 980 | 370 823 | 326 085 |
| Net incurred benefits | 148 622 | 147 969 | 160 666 | 261 564 | 187 271 |
| Management expenses | 206 691 | 199 442 | 171 075 | 178 981 | 147 118 |
| Net management expenses ratio (1) | 56.95% | 56.06% | 55.70% | 48.25% | 44.91% |
| Net result | 49 906 | 40 020 | 26 225 | 21 407 | 3 032 |
(1) Net management expenses ratio = Management expenses / Net reinsurance written premiums
Hollard Specialist Insurance as at 30 June 2022
| Share capital | 24 779 000 USD |
| Turnover | 61 655 000 USD |
| Assets | 62 248 000 USD |
| Shareholder’s equity | 30 405 000 USD |
| Net result | 12 058 000 USD |
| Net non-life loss ratio | 54,71% |
| Net non-life management expenses ratio | 25,61% |
| Net non-life combined ratio | 80,32% |
Hollard Specialist Insurance : main technical highlights
Figures in thousands USD
| Highlights | 2018 | 2019 | 2020 | 2021 | 2022 |
| Gross written premiums | 101 507 | 101 495 | 55 954 | 60 244 | 61 655 |
| Net written premiums | 100 388 | 100 418 | 55 371 | 59 854 | 60 589 |
| Net earned premiums | 98 590 | 97 208 | 59 854 | 61 962 | 60 594 |
| Net incurred losses | 41 021 | 41 489 | 25 318 | 33 525 | 33 153 |
| Management expenses | 42 275 | 42 435 | 22 477 | 20 877 | 15 514 |
| Net non-life loss ratio (1) | 41.61% | 42.68% | 42.30% | 54.10% | 54.71% |
| Net non-life management expenses ratio (2) | 42.11% | 42.26% | 40.59% | 34.88% | 25.61% |
| Net non-life combined ratio (3) | 83.72% | 84.94% | 82.89% | 88.98% | 80.32% |
| Net result | 18 384 | 15 117 | 12 153 | 9 488 | 12 058 |
(1) Net non-life loss ratio = Net non-life incurred losses / Net non-life earned premiums
(2) Net non-life management expenses ratio = Non-life management expenses/ Net non-life written premiums
(3) Net non-life combined ratio = Net non-life loss ratio+ Net non-life management expenses ratio
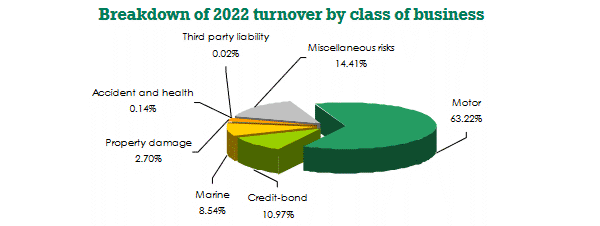
Hollard Specialist Insurance : breakdown of turnover by class of business
Figures in thousands USD
| 2018 | 2019 | 2020 | 2021 | 2022 | 2022 shares | |
| Motor | ND | 43 846 | 38 093 | 40 842 | 38 981 | 63.22% |
| Credit-bond | ND | 15 355 | 3 762 | 5 480 | 6 762 | 10.97% |
| Marine | ND | 4 247 | 3 116 | 3 721 | 5 268 | 8.54% |
| Property damage | ND | 40 | 6 | 16 | 1 663 | 2.70% |
| Accident and health | ND | 188 | 97 | 102 | 84 | 0.14% |
| Third party liability | ND | - | - | - | 14 | 0.02% |
| Miscellaneous risks | ND | 37 819 | 10 880 | 10 083 | 8 883 | 14.41% |
| Total | 101 507 | 101 495 | 55 954 | 60 244 | 61 655 | 100% |
Hollard Specialist Life as at 30 June 2022
| Share capital | 5 858 000 USD |
| Turnover | 42 138 000 USD |
| Assets | 71 704 000 USD |
| Shareholder’s equity | 55 835 000 USD |
| Net result | 10 117 000 USD |
Hollard Specialist Life : main technical highlights
Figures in thousands USD
| 2018 | 2019 | 2020 | 2021 | 2022 | |
| Gross written premiums | 59 731 | 51 561 | 42 646 | 48 904 | 42 138 |
| Net written premiums | 55 365 | 51 054 | 42 414 | 48 694 | 41 969 |
| Net earned premiums | 66 404 | 50 350 | 41 950 | 47 790 | 41 073 |
| Net incurred benefits | 19 413 | 7 223 | 9 274 | 28 806 | 14 770 |
| Management expenses | 25 320 | 24 217 | 18 042 | 19 416 | 16 376 |
| Net management expenses ratio (1) | 45,73% | 47,43% | 42,54% | 39,87% | 39,02% |
| Net result | 14 827 | 19 382 | 13 414 | 4 328 | 10 117 |
(1) Net management expenses ratio = Management expenses / Net reinsurance written premiums
Exchange rate as at 30/06/2022: 1 ZAR = 0.06187 USD ; 30/06/2021: 1 ZAR = 0.06981USD ; at 30/06/2020: 1 ZAR = 0.05785 USD ; at 30/06/2019: 1 ZAR = 0.0708 USD ; at 30/06/2018: 1 ZAR = 0.07272 USD
Hollard Insurance Group: Contact
| Head office | 22 Oxford Road, Parktown, PO Box 87419 Houghton, Johannesburg, South Africa |
| Phone | 0860 202 202 / +27 11 351 5000 |
| Fax | +27 11 351 3816 |
warwickb [at] hollard [dot] co [dot] za | |
| Website |