Container ship insurance
As container business is sensitive to the health of the global economy, the insurance performance for this type of risk is directly related to the strength of the economic activity. Here is an overview of this market.
Evolution of the container trade since the outbreak of the financial crisis
 The recent financial crisis has impacted maritime trade since the third quarter of 2008. The container market then suffered a sharp decline in all major trade routes. Much to the chagrin of the ship owners, this downturn has coincided with increased transport capacity. In their projections, the owners had counted on the growth in the trade volume that would last several years, so much that the year 2009 was the worst for the container shipping business since its inception. The year 2010 seems to be bouncing back slightly, but the situation is far short of offsetting the terrible years of 2008 and 2009.
Read also | Marine insurance
The main containerized routes
The main roads used by container ships are now on departure or destination in Asia: Asia-America, Asia-Northern Europe, Asia-Europe, South Asia and Middle East, the transatlantic route and finally inter-Asian routes. The growth of world container traffic is strongly linked to trade with China. Indeed, 70% of the traffic is driven by this country and is carried out in the direction of Europe or North America.
Asia-Europe routes
Container traffic collapsed during the first two quarters of 2008 due to lower consumption of European households. A strong euro has nonetheless allowed to initiate a recovery beginning in the third quarter with a return of demand for some consumer products, including technology products. The decrease in volumes was of 15% in 2009 at less than 12 million TEU (twenty foot equivalent unit).
In contrast, the route between Europe and Asia has resisted well with a development of 4.5%, with volumes, however, remaining twice lower in this direction.
Freight rates have been falling even more importantly: more than 50% decrease on the Asia–Europe road in 2009. An exporter, who used to pay an average of 2 030 dollars (including insurance) to send a container to Europe in the first quarter of 2008, paid just 1 023 dollars a year later. Freight rates fell by 25% on the reverse path, but the price was already very low.
The transpacific route
 Following the real estate crisis in the United States, the Asia–America trade collapsed. Domestic demand, which supported the American growth, strongly shrank. Freight volumes fell by 7.3% in 2009 in the Asia-America direction. The American exports mainly consist of paper, recyclable cardboard and cereals. Despite the competitiveness of the dollar, trade in North America and Asia has fallen confirming the American difficulty to regain growth. Freight rates have declined by 28% in the Asia-North America direction, and by 18% in the opposite direction.
The Transatlantic road
Trade volumes in the Europe-America direction have been particularly affected. They fell by 28% in 2008 and by 25% in 2009 while freight rates have suffered a loss of 24%. The America–Europe road has witnessed a decline of 15% in 2009 in relation to the number of containers traded while prices remained stable.
Intra Asia and North-South trade
Unlike the other major containerized routes, all trade on intra-Asian routes grew by 3% in 2009 driven by the Chinese economy.
The North-South routes, minor in terms of traffic, stand as niches. They have resisted the crisis, falling down by just 3% during this period.
The status of maritime supply today
 The sudden arrival of the crisis has caught the owners and operators by surprise as they had forecast a continued increase in traffic at the same pace as the one witnessed by the industry since 2003. The enormous volumes of containers departing from Asia had prompted new orders for even larger vessels.
The year 2009 has seen the emergence of boats whose average size exceeded that of previous years. The unit capacity were on average of 1 000 TEU in the late 1960s. In the late 1980s, the width of container ships exceeded that of the Panama Canal. The ships had then reached an average of 4 500 TEU. In 2006, the Emma Maersk for the first time crossed the 10 000 TEU with a volume of 14 000 TEU.
Today, ships of this size account for more than half of all container ship construction applications. In 2015, the new boats will no longer pass through the new locks of the Panama Canal.
Ports that can accommodate such capacities are limited in number. This means, new strategies for the carriage of goods to secondary ports must be designed. Maritime transport has found itself in the same configuration as the airline sector which has created specialized hubs to accommodate certain types of aircrafts (A380).
Number of container ships VLCS* / ULCS**
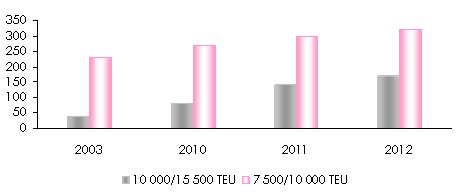 * Very Large Container Ships ** Ultra Large Container Ships
The guiding force of container transport is the unit cost per TEU / mile. The economy of scale is crucial in maintaining profit margins, especially with the ever-decreasing freight rate per unit. The marginal gains are, however, likely to be reduced with further increase in vessels size.
Strategy adjustment to deal with the crisis and the implications on the insurance market
To withstand the crisis, ship owners had to quickly readjust their strategy by:
- significantly reducing the capacity commissioned. Between August 2008 and late 2009, the market of transported containers has gone from 916 000 TEUs to 700 000 TEUs per week on three major East-West routes. The Asia-Mediterranean-Europe, Asia-North America and Europe-America routes were the hardest hit,
- deferring deliveries or transforming container ships under construction into oil and gas tankers,
- selecting the most modern and best adapted vessels to the transportation of goods.
By January 1, 2010, the fleet of container ships had 4 719 units for a volume of more than 13 million TEU, that is, an increase of 5.6% compared to 2009. This increase was of 10% per annum during the ten years preceding the 2008 crisis.
 Many ships remaining in port, the insurers have been facing a drop in the collection of premiums. Meanwhile, with the number of claims on the decline, falling traffic had no adverse effect on the loss ratio.
However, as risks increase, the problems pertaining to the size and security of vessels have become priority.
Container ship insurance: The fear of giant container ships
With an average size steadily increasing, the last generation of containers stands as a threat to insurers who fear the occurrence of major disasters. Vessel size and number of containers transported make up a colossal accumulation of insured values. The average value of a single container charge is 45 000 USD. A container ship of 9 600 TEU, represents an insured value 430 million USD for cargo, plus an additional average 70 million USD for the vessel. A giant container ship can carry up to 14 000 containers. The construction price of a giant container ship is now between 80 and 100 million USD.
Container ship insurance
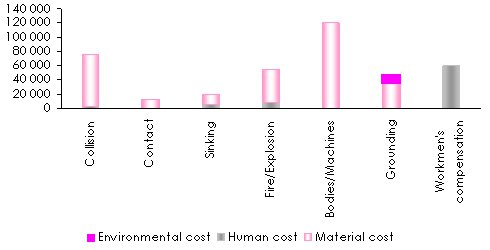
The main risks faced by container insurers are:
 collision with another vessel off the coast but especially in ports,
- collision with port equipment,
- stowage defect that could cause an imbalance of the ship, especially in bad weather. Between 5 000 and 15 000 containers are lost at sea every year. The loss of containerized hazardous products is a major environmental threat.
These losses are particularly important when the containers are overloaded: 18% of them have more than 6 tons of overload and 15% of the containers have poor balance, - collision with lost containers,
 the risk of fire in one of the containers, especially if hazardous materials were not properly reported and therefore stored in a place that does not ensure the safety of the ship,
- fall of containers during loading or unloading, which may damage the body of the vessel,
 the grounding of the ship, especially if it lies on its side. Rollover on the side of the ship, the withdrawal of thousands of containers on board, would take several months and the goods would be totally lost. The cost would be astronomical. In 2007, Kyrill storm caused the loss of the MCS Napoli with 2394 containers on board. It took four months to remove the containers. The 4 700 TEU vessel was only partly loaded (to almost half of its capacity). The total cost of the claim was close to 200 million USD, making it the second largest disaster in the history of maritime transport,
- breakdown which makes the boat uncontrollable, and increases the risk of total loss. Towing would be extremely difficult for giant container ships that have few traction spots. Indeed, container ships, mainly the larger ones, are unwieldy and their shape can make them highly crosswind,
- skeleton teams on board which leads to serious security problems,
- damages caused by worn stowage equipment, tacking, ...
- climate change increasing the risks of storms.
Container ship insurance is operated mainly on the London market. Like most of the ships, the standard coverage follows the framework defined by the “Marine Insurance Act 1906”. This framework provides an insurance against any risk due to shipping at sea, fire, explosions, war risk, maritime piracy, theft, capture, seizure, detention of the crew, abandonment, barratry, collision with a ship or other floating object, lightning and volcanic eruptions as well as any other peril named in the policy. Additional insurance policies are underwritten by the P&I clubs.
Average annual loss amount of a 4 500 TEU ship: 359 000 USD/year
USD/ship/year