Insurance in the Gulf countries (Part 1)
An overview of the markets
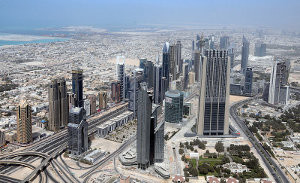 Dubai Financial Centre, United Arab Emirates © Citizen59, CC BY 3.0 Dubai Financial Centre, United Arab Emirates © Citizen59, CC BY 3.0 |
The global market has reported a premiums volume of 4 595 billion USD in 2011. From 2001 to 2011 the average annual growth has been about 7%. This growth is strongly correlated with the GDP which grew during the same period by 5.6% in developed countries and by 13.9% in the so-called emerging countries.
Breakdown of life and non life markets in 2010
in billions USD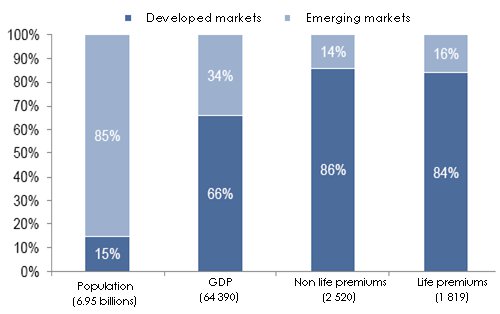
The different emerging markets worldwide in 2010
in billions USD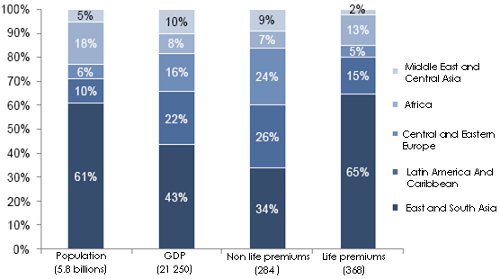 Source: Swiss Re, Alpen Capital
 In 2011, the overall life and non-life insurance premiums account for 6.6% of the global GDP, compared to 6.7% in 2010. Worldwide, the per capita premium amounts to 660.7 USD. The insurance penetration rate in developed countries ranges between 4.2% and 13.2% while it is significantly lower in developing countries.
Insurance penetration rate of some developed and emerging markets in 2011
| Overall penetration rate | Life penetration rate | Non life penetration rate | |
|---|---|---|---|
| Developed countries | |||
United Kingdom | 11.8% | 8.7% | 3.1% |
Japan | 11% | 8.8% | 2.2% |
United States | 8.1% | 3.6% | 4.5% |
Germany | 6.8% | 3.2% | 3.6% |
| Central and Eastern Europe | |||
Czech Republic | 3.9% | 1.8% | 2.1% |
Poland | 3.7% | 1.8% | 1.9% |
Hungary | 2.8% | 1.5% | 1.2% |
Croatia | 2.7% | 0.7% | 2% |
Russia | 2.4% | 0.1% | 2.3% |
Bulgaria | 2% | 0.1% | 1.9% |
Ukraine | 2% | 0.1% | 1.9% |
Romania | 1.5% | 0.3% | 1.2% |
Turkey | 1.3% | 0.2% | 1.1% |
| Gulf countries | |||
Bahrain | 2.4% | 0.6% | 1.8% |
United Arab Emirates | 1.8% | 0.3% | 1.5% |
Oman | 1.1% | 0.2% | 0.9% |
Saudi Arabia | 0.9% | 0.1% | 0.8% |
Qatar | 0.5% | 0% | 0.5% |
Kuwait | 0.5% | 0.1% | 0.4% |
| Latin America | |||
Chile | 4.1% | 2.4% | 1.8% |
Brazil | 3.2% | 1.7% | 1.5% |
Argentina | 2.9% | 0.6% | 2.3% |
Colombia | 2.3% | 0.7% | 1.6% |
Mexico | 1.9% | 0.9% | 1% |
Peru | 1.5% | 0.7% | 0.8% |
| Asia | |||
Taiwan | 17% | 13.9% | 3.1% |
Malaisia | 5.1% | 3.3% | 1.8% |
Thailand | 4.4% | 2.7% | 1.7% |
India | 4.1% | 3.4% | 0.7% |
China | 3% | 1.8% | 1.2% |
Philippines | 1.3% | 0.8% | 0.5% |
| Africa | |||
South Africa | 12.9% | 10.2% | 2.7% |
Namibia | 8% | 5.5% | 2.5% |
Mauritius | 5.2% | 3.4% | 1.9% |
Kenya | 3.2% | 1.1% | 2.1% |
Morocco | 2.9% | 0.9% | 2% |
Tunisia | 1.8% | 0.3% | 1.5% |
Angola | 1.1% | 0.1% | 1% |
Algeria | 0.7% | 0.1% | 0.6% |
Egypt | 0.7% | 0.3% | 0.4% |
Nigeria | 0.6% | 0.2% | 0.5% |
The insurance market in the Gulf
Presentation
The insurance markets in the Gulf countries are in a transitory stage, and have not yet reached the critical size. The transformation of the sector into a modern industry open to competition is underway. In addition, the establishment of a new legal framework is slow and gradual but noticeable. Insurers on the market have understood this trend and are keen to take advantage of the new opportunities.
GDP growth: 2007-2015*
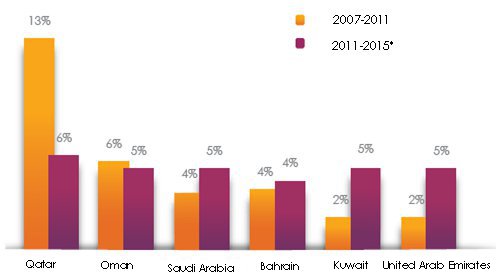 * Estimation Source: GCC Insurance Barometer, No 1, May 2012
 ") Al-Faisaliyah center, Riyadh, Saudi Arabia Al-Faisaliyah center, Riyadh, Saudi Arabia |
The favorable economic situation prevailing for many years and the limited impact of the crisis on these countries have led to a steady development of business despite the significant slowdown sensed after 2008.
With the exception of Saudi Arabia, the Gulf countries are home to a small and young population.
The number of expatriates living there is quite high. While insurance penetration rate has increased by nearly 80% between 2001 and 2011, it remains, nonetheless, well below the 6.6% global average.
Thanks to the oil boom, economic growth remains strong and one of the largest in the world.
Insurance density is low despite the important growth of the population’s living standards. It is even lower than that of many developing countries worldwide. In the Gulf countries, insurance density is 353.2 USD on average in 2011, driven by the United Arab Emirates which dominates the region with 1 380 USD.
Insurance density of some developed and emerging markets in 2011
in USD| Overall density | Life density | Non life density | |
|---|---|---|---|
| Developed countries | |||
Japan | 5 169 | 4 138 | 1 031 |
United Kingdom | 4 535 | 3 347 | 1 188 |
United States | 3 846 | 1 716 | 2 130 |
Germany | 2 967 | 1 389 | 1 578 |
| Central and Eastern Europe | |||
Czech Republic | 832 | 386 | 445 |
Poland | 500 | 242 | 258 |
Hungary | 397 | 220 | 178 |
Croatia | 389 | 104 | 286 |
Russia | 303 | 8 | 295 |
Bulgaria | 151 | 22 | 129 |
Turkey | 136 | 21 | 115 |
Romania | 122 | 26 | 96 |
Ukraine | 68 | 4 | 65 |
| Gulf countries | |||
United Arab Emirates | 1 380 | 255 | 1 126 |
Qatar | 530 | 30 | 500 |
Bahrain | 425 | 109 | 316 |
Kuwait | 289 | 66 | 223 |
Oman | 270 | 53 | 217 |
Saudi Arabia | 177 | 10 | 167 |
| Latin America | |||
Chile | 559 | 323 | 237 |
Brazil | 398 | 208 | 189 |
Argentina | 367 | 15 | 352 |
Colombia | 315 | 64 | 251 |
Mexico | 193 | 88 | 106 |
Peru | 89 | 42 | 47 |
| Asia | |||
Taiwan | 3 371 | 2 757 | 614 |
Malaisia | 502 | 328 | 175 |
Thailand | 222 | 134 | 88 |
China | 163 | 99 | 64 |
India | 59 | 49 | 10 |
Philippines | 30 | 20 | 10 |
| Africa | |||
South Africa | 1 037 | 823 | 215 |
Mauritius | 470 | 303 | 167 |
Namibia | 418 | 287 | 131 |
Morocco | 89 | 27 | 62 |
Tunisia | 77 | 11 | 66 |
Angola | 51 | 3 | 48 |
Algeria | 33 | 3 | 31 |
Kenya | 25 | 9 | 16 |
Egypt | 21 | 9 | 12 |
Nigeria | 10 | 3 | 7 |
Characteristics per country
The premiums volume generated by Gulf countries reached 14.730 billion USD in 2011. During the 2006-2011 period, overall premiums multiplied by 2.35, which corresponds to an average annual growth rate of 18.7%, with life insurance increasing by 21.2% and non-life insurance reporting an 18.3% rate.
Evolution of life and non life premiums: 2006-2011
in millions USD| 2006 | 2007 | 2008 | 2009 | 2010 | 2011 | |
|---|---|---|---|---|---|---|
Life | 783 | 1 203 | 1 314 | 1 595 | 1 787 | 2 050 |
Non life | 5 470 | 7 099 | 9 186 | 10 329 | 11 845 | 12 680 |
Total | 6 253 | 8 302 | 10 500 | 11 924 | 13 632 | 14 730 |
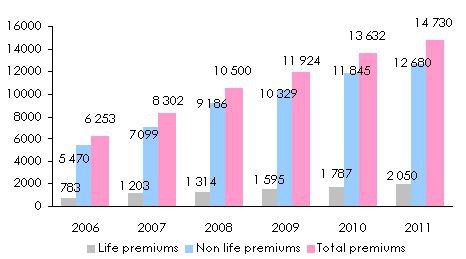 Source: Sigma report, No 3/2012
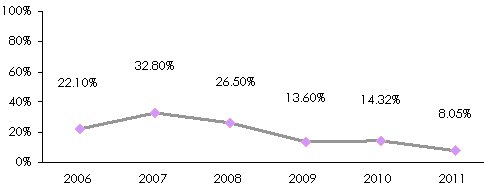
Evolution of premiums’ growth rate: 2006-2011
Forecast of premiums’ growth: 2012-2015
in millions USD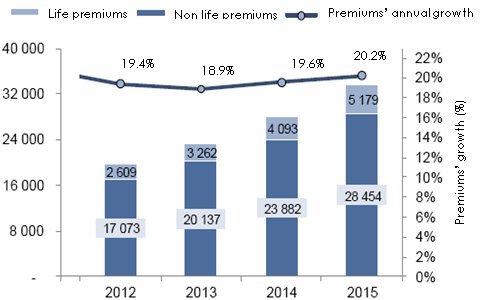
Breakdown of life and non life premiums per country in 2011
in millions USD| Country | Life premiums | Non life premiums | Total | Market shares |
|---|---|---|---|---|
United Arab Emirates | 1 226 | 5 415 | 6 641 | 45.09% |
Saudi Arabia | 289 | 4 682 | 4 971 | 33.75% |
Qatar | 54 | 908 | 962 | 6.53% |
Kuwait | 185 | 627 | 812 | 5.51% |
Oman | 150 | 616 | 766 | 5.20% |
Bahrain | 148 | 430 | 578 | 3.92% |
Total | 2 052 | 12 678 | 14 730 | 100% |
Non-life insurance largely dominates the market, accounting for 86% of the premium income. The United Arab Emirates and Saudi Arabia are the main markets of the region.
Breakdown of 2011 premiums per country
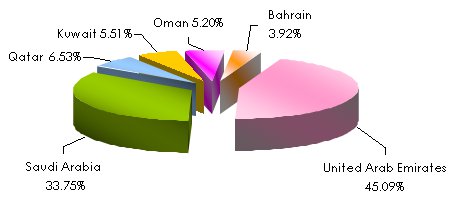 Source: Sigma report, No 3/2012
 The market structure
Numerous local and international insurers are operating on the Gulf markets. With nearly 200 insurance companies, the market remains highly fragmented.
Along with direct sales, intermediaries (agents and brokers) stand as the main distribution channel of insurance policies. Bancassurance is growing rapidly while the marketing of products via the internet and mobile phones is lagging behind.
Main insurers per country
| Country | Number of insurers | Shares in % of the top 3 insurers | Top 3 insurers of the market | |||
|---|---|---|---|---|---|---|
| Total | NL | L | Composite | |||
Bahrain | 36 | 29 | 3 | 4 | 29% |
|
Kuwait | 29 | 14 | 2 | 13 | NA |
|
EAU | 57 | NA | NA | NA | 21% |
|
Oman | 23 | 12 | 2 | 9 | 22% |
|
Saudi Arabia | 26 | NA | NA | NA | 53% |
|
Qatar | 9 | 6 | NA | 3 | 65% |
|
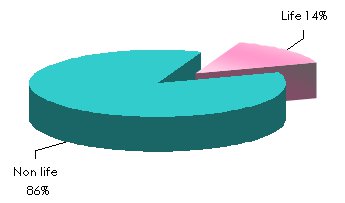
With a premium income of 12.680 billion USD in 2011, non-life insurance dominates by far the landscape. It accounts for 86% of the premiums volume and remains the main engine of the insurance business. Motor insurance contributes with the most of non life premiums, while the health class of business is undergoing renewed dynamism after it has been made compulsory by the authorities.
Totaling 2.050 billion USD in 2011, and accounting for 14% of the activity, life insurance has been growing more steadily in recent years. The economic situation in the Gulf helps to maintain relatively robust growth, offering savings prone to be invested in the life insurance.
The presence of international insurance groups
") Manama view, Bahrain Manama view, Bahrain |
Until recently, the obstacles barring the foreign companies from entering the local markets have compromised opportunities for development for international insurance groups in the region.
The various amendments to the legislation and the easing of constraints on foreign participation in local companies’ capital have changed the situation.
The big international groups are now investing heavily in national insurers. Life insurance companies, whose potential is largely underexploited, are one of the privileged targets. These groups also rely on the massive presence of expatriate population who naturally resort to the insurers whose names are more familiar to them.
International insurers provide capital and know-how, imposing more strict underwriting criteria and rigorous financial management.
Breakdown of 2011 premiums per life and non life insurance
Distribution of insurance policies
Brokers and direct sales are the main channels of non-life products distribution. In life insurance, agents are widely present when it comes to the sale of individual policies whereas brokers are very active in group insurance. Bancassurance is slowly emerging while agreements between insurers and bankers are increasing.
The distribution channels
| Class of business | Agents in % | Brokers in % | Direct business in % | |
|---|---|---|---|---|
Bahrain | Motor | 5 | 50 | 45 |
| Other non life classes of business | 5 | 60 | 35 | |
United Arab Emirates | Motor | 20* | 30 | 50 |
| Other non life classes of business | 5 | 50 | 45 | |
Qatar | Motor | 20 | 10 | 70 |
| Other non life classes of business | 2 | 8 | 90 | |
Oman | Motor | 25 | 30 | 45 |
| Other non life classes of business | 5 | 50 | 45 | |
Saudi Arabia | Motor | 10 | 20 | 70 |
| Other non life classes of business | 5 | 47 | 48 | |
Kuwait | Motor | 40 | 20 | 40 |
| Other non life classes of business | 10 | 50 | 40 |