Kenya Reinsurance Corporation Limited (Kenya Re)
 After a period of uncertainty, Kenya Re has in recent years managed to exhibit positive results in steady growth.
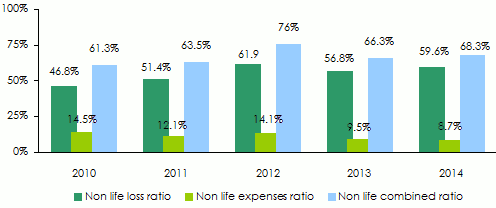
Over the past five years, the premiums, the net result and the shareholders' equity have been increasing from year to year. From 2010 to 2014, premiums went twofold while non life management expenses rose from 14.5% in 2010 to 8.7% in 2014.
Coupled with a loss ratio maintained within acceptable standards, these management fees sharply down yielded a combined ratio of 66.3% in 2013 and 68.3% in 2014. The dream for many reinsurers would be to settle with a combined ratio of 95%.
This command over the fundamentals of reinsurance allows Kenya Re to adopt a more aggressive development strategy. The company is no longer focused solely on East African markets. With the establishment of its subsidiary in Abidjan, it has opened to French-speaking Africa, pending further similar initiatives.
 |  |
| Nelius Kariuki | Jadiah Mwarania |
| Chairman of the board | Managing director |
Kenya Re is, in 2014
| Share capital | 20 000 000 USD |
| Turnover | 129 932 000 USD |
| Assets | 361 317 000 USD |
| Shareholder’s equity | 224 503 000 USD |
| Net result | 35 230 000 USD |
| Net non life loss ratio | 59.6% |
| Non life expenses ratio | 8.7% |
| Non life combined ratio | 68.3% |
| Number of subsidiaries | 1 in Côte d’Ivoire |
| Employees | 100 |
Board of directors and management
| Nelius Kariuki | Chairman of the board |
| Jadiah Mwarania | Managing director |
| Beth Nyaga | General manager, reinsurance operations |
| Rogers Kinoti | Manager, finance and investments |
| Salome Kangethe | Manager, administration and human resources |
| Jane Odipo | Manager, marketing and business development |
| Nancy Imunde | Manager, corporate affairs |
| Arthur Levry | West Africa office manager |
Main shareholders
| State | 60% |
| Private investors | 40% |
Main technical highlights: 2010 - 2014
in thousands USD| 2010 | 2011 | 2012 | 2013 | 2014 | |
|---|---|---|---|---|---|
Gross written premiums | 63 805 | 79 102 | 92 788 | 113 331 | 129 932 |
Written premiums net of reinsurance | 60 219 | 74 726 | 88 299 | 108 127 | 123 997 |
Net earned premiums | 54 749 | 68 587 | 82 394 | 100 837 | 115 820 |
Non life net earned premiums | 47 161 | 58 364 | 71 833 | 89 139 | 104 428 |
Life net earned premiums | 7 588 | 10 223 | 10 561 | 11 698 | 11 392 |
Net incurred losses | 26 222 | 35 160 | 47 439 | 55 497 | 66 903 |
Non life net incurred losses | 22 052 | 30 007 | 44 493 | 50 601 | 62 271 |
Life net incurred losses | 4 170 | 5 153 | 2 946 | 4 896 | 4 632 |
Life and non life management expenses | 8 945 | 9 246 | 12 663 | 11 924 | 12 271 |
Net non life loss ratio | 46.8% | 51.4% | 61.9% | 56.8% | 59.6% |
Non life expenses ratio(1) | 14.5% | 12.1% | 14.1% | 9.5% | 8.7% |
Non life combined ratio | 61.3% | 63.5% | 76% | 66.3% | 68.3% |
Net result | 19 745 | 22 898 | 32 726 | 32 811 | 35 230 |
Evolution of premiums, losses and results: 2010-2014
in thousands USD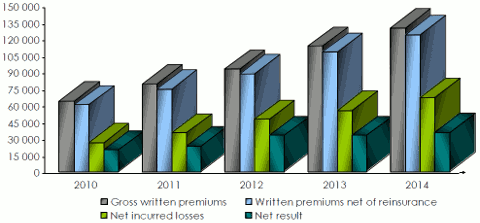
Turnover’s breakdown per class of business: 2010-2014
in thousands USD| 2010 | 2011 | 2012 | 2013 | 2014 | 2014 shares | |
|---|---|---|---|---|---|---|
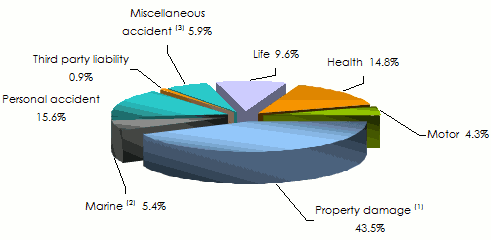
Motor | 4 220 | 4 770 | 4 721 | 5 433 | 5 611 | 4.3% |
Property damage (1) | 35 293 | 41 070 | 44 746 | 51 245 | 56 511 | 43.5% |
Marine (2) | 5 188 | 6 213 | 6 152 | 7 859 | 7 026 | 5.4% |
Health | - | 5 641 | 13 129 | 17 036 | 19 202 | 14.8% |
Personal accident | 6 104 | 4 608 | 6 169 | 9 392 | 20 251 | 15.6% |
Third party liability | 600 | 933 | 975 | 1 420 | 1 182 | 0.9% |
Miscellaneous accident (3) | 3 508 | 4 113 | 4 602 | 8 140 | 7 684 | 5.9% |
Total non life | 54 913 | 67 348 | 80 494 | 100 525 | 117 467 | 90.4% |
Life | 8 892 | 11 754 | 12 294 | 12 806 | 12 465 | 9.6% |
Grand total | 63 805 | 79 102 | 92 788 | 113 331 | 129 932 | 100% |
Turnover’s breakdown per class of business in 2014
 (1) including fire, engineering and theft classes of business
(2) including aviation
(3) including workmen’s compensation
Non life net earned premiums: 2010-2014
in thousands USD| 2010 | 2011 | 2012 | 2013 | 2014 | |
|---|---|---|---|---|---|
Motor | 4 001 | 4 438 | 4 696 | 5 160 | 5 443 |
Property damage (1) | 30 130 | 35 780 | 40 669 | 45 733 | 48 521 |
Marine (2) | 4 103 | 5 225 | 5 826 | 7 120 | 7 040 |
Health | - | 3 384 | 10 081 | 15 505 | 18 034 |
Personal accident | 4 762 | 5 045 | 5 502 | 8 118 | 15 741 |
Third party liability | 635 | 784 | 949 | 1 244 | 1 253 |
Miscellaneous accident (3) | 3 530 | 3 708 | 4 110 | 6 259 | 8 396 |
Grand total | 47 161 | 58 364 | 71 833 | 89 139 | 104 428 |
(2) including aviation
(3) including workmen’s compensation
Non life net incurred losses: 2010-2014
in thousands USD| 2010 | 2011 | 2012 | 2013 | 2014 | |
|---|---|---|---|---|---|
Motor | - 3 544 | 1 736 | 3 793 | 3 353 | 3 873 |
Property damage (1) | 17 556 | 17 997 | 20 525 | 20 080 | 22 949 |
Marine (2) | 2 439 | 2 265 | 2 739 | 2 764 | 4 359 |
Health | - | 3 029 | 10 787 | 14 890 | 15 117 |
Personal accident | 4 184 | 4 321 | 5 306 | 6 339 | 13 756 |
Third party liability | 103 | - 101 | 338 | 324 | - 44 |
Miscellaneous accident (3) | 1 314 | 760 | 1 005 | 2 851 | 2 261 |
Grand total | 22 052 | 30 007 | 44 493 | 50 601 | 62 271 |
(2) including aviation
(3) including workmen’s compensation
Non life loss ratio: 2010-2014
in thousands USD| 2010 | 2011 | 2012 | 2013 | 2014 | |
|---|---|---|---|---|---|
Motor | 88.6% | 39.1% | 80.8% | 65% | 71.2% |
Property damage (1) | 58.3% | 50.3% | 50.5% | 43.9% | 47.3% |
Marine (2) | 59.4% | 43.3% | 47% | 38.8% | 61.9% |
Health | - | 89.5% | 107% | 96% | 83.8% |
Personal accident | 87.9% | 85.6% | 96.5% | 78.1% | 87.4% |
Third party liability | 16.2% | 12.9% | 35.6% | 26% | 3.5% |
Miscellaneous accident (3) | 37.2% | 20.5% | 24.5% | 45.5% | 26.9% |
Grand total | 46.8% | 51.4% | 61.9% | 56.8% | 59.6% |
(2) including aviation
(3) including workmen’s compensation
Evolution of non life ratios: 2010-2014
 Figures extract from the different balance sheets of Kenya Re
Exchange rate KES/TND as at 31/12 | 2010 | 2011 | 2012 | 2013 | 2014 |
0.01281 | 0.01196 | 0.01168 | 0.01175 | 0.01123 |

Kenya Reinsurance Corporation
(Kenya Re)
| Head office | Reinsurance Plaza, Taifa Road 15th floor, Nairobi 00100, Kenya |
| Phone | +254 20 2202000 |
| Fax | +254 20 2223944 |
kenyare [at] kenyare [dot] co [dot] ke | |
| Website |