Non-life reinsurance, the 2012 renewal
")
Clearly declining half-year results
The year 2011 will be engraved in reinsurers’ memories as it had generated losses of exceptional magnitude, especially in Japan, New Zealand, Australia and the United States. According to Swiss Re, the natural catastrophe losses for the first semester amount to 70 billion USD. It is twice the sums paid at the same period of 2010. After 2005 which saw hurricanes Katrina, Rita and Wilma lash American coasts, 2011 stands as the costliest year for reinsurers.
Results of the main reinsurers during the first semester
in millions USD| Hannover Re | Munich Re | Partner Re | Scor | Swiss Re | |
|---|---|---|---|---|---|
Profit or loss of the 1st semester 2011 | 314.4 | -302.1 | -982.5 | 57 | 295 |
Profit or loss of the 1st semester 2010 | 379.1 | 1 457 | 330 | 190 | 970 |
Evolution of the net profit between the 1st semester 2010 and the 1st semester 2011 | -29.7% | -669% | -352% | -74.4% | -69.6% |
Non life combined ratio, 1st semester 2011 | 110.3% | 133.1% | 147.1% | 113.1% | 119.4% |
Non life combined ratio, 1st semester 2010 | 99.5% | 106.4% | 103.8% | 102.5% | 105.9% |
Evolution of the net profit between the 1st semester 2010 and the 1st semester 2011 | +10.8% | +25.1% | +41.7% | +10.3% | +12.7% |
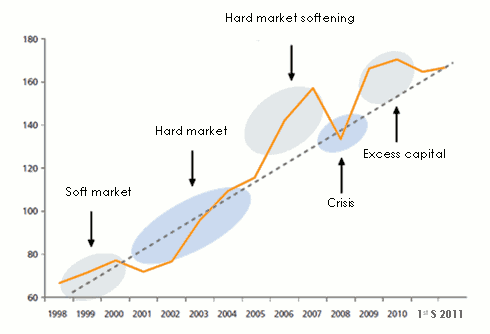
Evolution of the non life combined ratio for the 2001–2011 period (average of the 24 reinsurers rated by Fitch as at the first semester 2011)
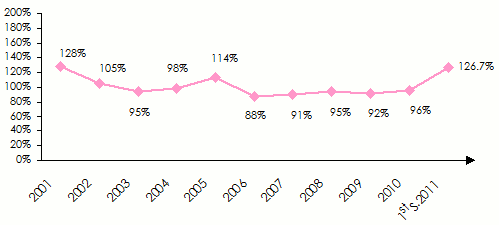
In the first semester of 2011, the average combined ratio of the 24 reinsurers rated by the agency Fitch attained 126.7%. The end-of-the-year forecasts should be around 108%, compared to 96% in 2010.
Standard & Poor’s is expecting all reinsurers to make low profits for 2011 and that short-term profitability will be questioned. At worst, the release of the reserves constituted during the previous years should be enough to redress the situation.
Demand for reinsurance remains quite high in the MENA region and Asia
The environment of reinsurance in North Africa and the Middle East remains relatively stable even if, by some accounts, an evolution is underway. It is triggered by legislative changes sometimes conducted for protectionist purposes. Evolution may also result from the local players themselves.
In the MENA region, non-life insurers’ dependence on reinsurance remains quite strong, especially for commercial and industrial risks. This dependence partially results from the form of reinsurance adopted, the retention level of cedants and the solid growth of the premiums written in recent years.
In this zone, proportional reinsurance remains the most used type of cession. Companies place their business on a bouquet basis pushing reinsurers to take part in all of the different classes of business. This approach makes it possible to offset the losses of some treaties by the good results achieved in the others. The 30% to 45% commissioning level remains high.
The retentions in use remain poor in relation to the underwriting capacity and are moreover generally covered by non-proportional treaties having low priorities. Retentions in non-life insurance are above those practiced in life.
Recourse to facultative reinsurance is very important especially in energy, aviation, engineering and fire risks.
The use of fronting is fairly common.
While insurers’ equity funds are increasing gradually, retentions are struggling to augment because of the excessive capacity made available to cedants by reinsurers.
Asian markets are witnessing a global decline of the legal cession, hence the possibility for reinsurers, others than nationals to seize part of the premiums. It is equally worth noting that the ever-growing adoption of risk-capital models increases demands for reinsurance. In Asia, an evolution of European prudential rules, called solvency II, is not to be ruled out in the coming years. Asian economies account for 30% of global GDP and 59% of the world’s population while the reinsurance premiums collected by this continent accounts for just 10% of the world’s market.
Regional and national reinsurers
 The development of the primary market in the MENA region has triggered the arrival of new reinsurers: ACR Retakaful, Hannover Re Takaful, Al Fajer, Gulf Re, ACE Mena, Oman Re, Saudi Re or Qatar Re. these new companies are developing rapidly but find it hard to comply with their initial business plan which often remains largely over-estimated.
Gulf Re is the regional reinsurer whose underwriting is the most focused on a single zone since 95% of its premium income is solely accounted for by the Gulf Countries. Contrarily, Best Re, Trust Re, ARIG, Milli Re, Al Fajer Re are among the regional reinsurers which have undertaken a considerable geographic diversification, namely in Asia, Africa or in the ex countries of the Soviet Union. They lead the proportional programs of small and medium insurers along with numerous excess-of-loss treaties.
Like Africa Re, Best Re or Trust Re, most of the regional reinsurers are resisting well to international reinsurers on these markets, thanks, partially, to an improvement of their rating.
By positioning itself as a specialist in energy and property damage risks, Trust Re is distancing itself from its competitors, becoming the first regional reinsurer of the MENA zone.
Regional reinsurers’ retentions are substantial, often reaching 80% to 90% of their premium incomes.
Alongside the new comers, the national traditional reinsurers remain present. Out of the 19 North African and Middle Eastern countries, 12 national reinsurers are in business. Initially focused on their local market, national reinsurers have undertaken a diversification of their portfolio by extending their operations on the African and Asian markets (outside Japan).
This diversification renders them vulnerable to natural catastrophes and compels them to purchase costly retrocession covers in order to limit the volatility of their portfolio.
Being well-positioned on their local markets, national reinsurers often benefit from a local premiums volume that is visibly higher than that obtained from their international operations.
Gross written premiums of national and regional reinsurers in the MENA zone: 2008-2010
In thousands USD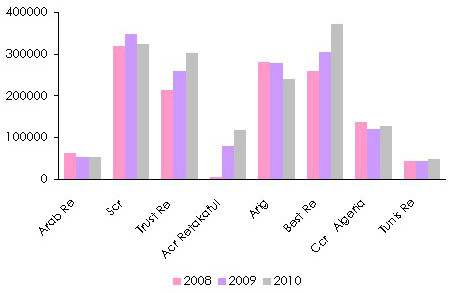 Source: AM Best
 In Asia, the domination of State reinsurers is noticeable. They have for a long time benefited from legal cessions to establish their notoriety and develop their network. GIC (India), which managed to establish ties in Asia, Middle East and in East Africa is the best illustration of this finding.
The gradual deregulation of the markets, especially in India and China, has compelled national reinsurers to deal with new competitors, witnessing, very often, a decline in their basic positions.
Takaful reinsurance is equally growing but remains inadequate in terms of premiums volume. Takaful insurance, however, has witnessed an important evolution in recent years by posting annual progression comprised between 20% and 30%. This segment made 8 billion USD of profits in 2010.
MENA: retention of national and regional reinsurers: 2008-2010
Retention ratios in %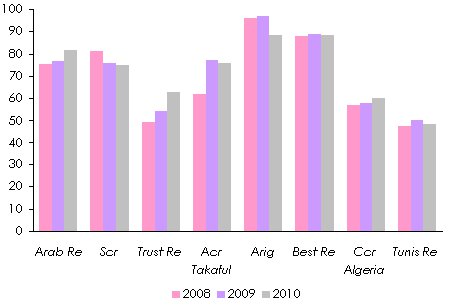 Source: AM Best
 The great international reinsurers
Munich Re, Swiss Re, Scor, Hannover Re and Korean Re are the main leaders of facultative and conventional reinsurance in the MENA zone. They impose prices and are the cause behind the often more compelling conditions for ceding companies.
These key reinsurers are, nonetheless, under more and more assaults by the less sizable players mainly GIC, Asia Capital, Odyssey Re, Partner Re, Allianz, Mitsui or Trust Re.
To meet this threat, leading reinsurers highlight the additional services offered to their partners: technical support, especially for target risks, training, …
The MENA zone is relatively exposed to natural catastrophes. The floods and earthquakes which regularly hit Algeria and stand as a potential threat for Lebanon, Jordan and Morocco are the highest risks. This region is particularly important to international reinsurers including Lloyd’s and the Bermudans. It allows significant diversification of portfolio, which is appreciated by rating agencies.
The success of pools
Numerous pools can be found in the MENA zone. They provide credible alternatives for additional capacity in some classes of business and in retrocession. They are equally useful as they permit to retain a share of the risks within the region. Member reinsures and insurers of these pools take advantage of additional diversification of their portfolio profile.
The main pools of the MENA zone are:
- the FAIR Poolprovides capacity for three types of risks:
- the Non-Life Pool: fire, engineering, marine hull and cargo. It is run by Milli Re (Turkey).
- the Aviation Pool whose management has been entrusted to SCR (Morocco).
- the Oil and Energy Insurance Syndicate, which is run by Trust Re.
- the Arab War Risks Insurance Syndicate (AWRIS). This pool is focused on war risks. It has 19 members originating from Arab countries.
- the Arab Reinsurance Pool is run by Arab Re (Lebanon). It gathers fire, engineering, marine hull and cargo and health acceptances coming from Arab countries. The Lebanese reinsurance company is examining the prospect of establishing a takaful pool.
The first ten world reinsurers
in thousands USD| Country | Turnover 2010 | Turnover 2009 | AM Best rating | S & P rating | |
|---|---|---|---|---|---|
Munich Re | Germany | 31 280 000 | 34 333 000 | A+ | AA- |
Swiss Re | Switzerland | 24 756 000 | 27 647 000 | A | AA- |
Hannover Re | Germany | 15 147 000 | 14 728 000 | A | AA- |
Berkshire Hathaway | United States | 14 374 000 | 12 048 000 | A++ | AA+ |
Lloyd’s | United Kingdom | 12 977 000 | 12 723 000 | A | A+ |
Scor | France | 8 872 000 | 9 143 000 | A | A |
Reinsurance Group of America | United States | 7 201 000 | 6 244 000 | A+ | AA- |
Partner Re | Bermuda | 4 881 000 | 3 993 000 | A+ | AA- |
Everest Re | Bermuda | 4 201 000 | 4 129 000 | A+ | A+ |
Transatlantic | United States | 4 133 000 | 4 204 000 | A | A+ |
The 2012 renewal: the trends
Reinsurers operating in the MENA zone have been surprised by the outbreak of the events related to the Arab Spring. Even though some revolts were not ruled out here and there, very few people could have imagined such a swift contagion. As a consequence, a non-negligible number of damage to property treaties have been affected by those events.
While riot and civil commotion insurance is covered by master insurance policies (sometimes with limits), the situation remains quite unclear as to the coverage by some reinsurance treaties. Ceding companies have, nonetheless, managed to be indemnified when given the benefit of the doubt. It remains quite probable that reinsurers should step forward to clarify this issue during next renewal. If total exclusion of this cover is difficult to impose, reinsurers will attempt to introduce some limits or additional requirements:
- obligation to price these events in the master policies,
- coverage limited to a certain percentage of the sums insured by the master policies,
- limitation of reinsurance covers per event and per year. This limit may pertain to facultative and conventional reinsurance,
- coverage exclusion from top layers of non-proportional treaties, or limitation of the number of reinstatements related to these events.
Apart from Bahrain, these clauses seem, nevertheless, difficult to introduce in the Gulf countries.
The 2012 tariffs
The Monte Carlo rendez-vous has confirmed the market recovery trend, especially for the buyers of natural catastrophe covers. The areas most affected by tariff increases are Japan, Australia, New Zealand, the United States and Northern Europe even though a large portion of the increases has been already implemented during the year. The April and July renewals in the property damage insurance have resulted in remarkable increases: +60% in Japan, +50% to 75% in Australia and New Zealand, +7% to 12% in the United States. The Asian continent has not been spared nature’s awesome fury, especially China, Thailand and the Philippines.
Even though reinsurers cannot apply tariff increases to all classes of business and to all regions, experts do not rule out a 5% to 8% price rise in the MENA zone and in Africa for the treaties which sustained losses or those exposed to the hazards of nature. For the other treaties, the trend swings in favor of maintaining the current conditions.
Evolution of the world ROL regarding the overall natural catastrophes treaties
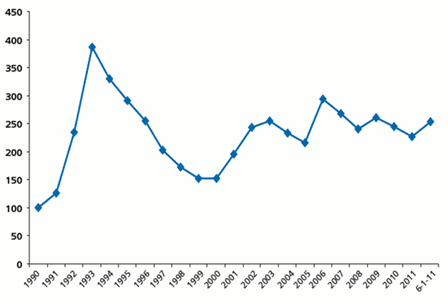 Source: Guy Carpenter & Company, LLC The renewal dates mentioned above are relative to the first January of the considered year except the one of first June 2011.
 Capitalization of the reinsurance sector
The long-awaited tariff adjustment is faced with the problem of spare capacity. This excess is enough for reinsurance cover rates to remain stable in most classes of business, categories and regions. Reinsurance tariffs go strengthened when capital levels are inadequate and vice versa.
 Source: Guy Carpenter & Company, LLC
 According to AON, reinsurers will conclude the year 2011 with a global capital level above the 470 billion USD posted at the beginning of the year despite the cost of the natural catastrophes of the first semester of 2011.
") Guy Carpenter, on the other hand, thinks that reinsurers’ capital level on January first was above 20 billion USD, commensurate with the average historic level. In view of the losses due to natural events (70 billion USD), the premiums collected by reinsurers, the financial performance and other factors, Guy Carpenter evaluates reinsurers’ capital surplus at 10 billion USD. This amount is dwindling in comparison with January 1, 2011, yet still above historic levels. Tightening capital accounts for tariff increase as regards treaties exposed to natural catastrophes; but as the sector has enough capital, the impact of tariff increases will be minor. Rating agencies have, in this regard, confirmed the reinsurance sector’s outlook to be solid.
Guy Carpenter, on the other hand, thinks that reinsurers’ capital level on January first was above 20 billion USD, commensurate with the average historic level. In view of the losses due to natural events (70 billion USD), the premiums collected by reinsurers, the financial performance and other factors, Guy Carpenter evaluates reinsurers’ capital surplus at 10 billion USD. This amount is dwindling in comparison with January 1, 2011, yet still above historic levels. Tightening capital accounts for tariff increase as regards treaties exposed to natural catastrophes; but as the sector has enough capital, the impact of tariff increases will be minor. Rating agencies have, in this regard, confirmed the reinsurance sector’s outlook to be solid.
Reinsurers started the year 2011 with a good level of solvency, achieved thanks to the good technical results of the previous years. According to S&P, the most significant 26 non-life reinsurers sustained a total net loss of 5 billion USD in the first quarter of 2011.
 The second quarter made it possible to make 3 billion USD of shareholder’s equity. Still according to S&P, these reinsurers have a surplus of 35 to 40 billion USD in shareholder’s equity. The estimate bracket of the different analysts is wide, stretching from 10 to 80 billion USD of excess capital.
The retrocession issue
Some reinsurers depend largely on retrocession. It seems that the market will maintain its capacities unchanged during the 2012 renewal but with less attractive tariff conditions for the buyers. Capital alternative sources such as Cat Bonds may take advantage of this situation to bounce back after years of sluggishness.
Ranking of reinsurers per turnover and per zone
Middle East zone
in thousands USD| Country | Turnover 2010 | Turnover 2009 | Capital 2010 | AM Best rating | S & P rating | |
|---|---|---|---|---|---|---|
Trust Re | Bahrain | 301 866 | 259 365 | 100 000 | A- | BBB+ |
Arig | Bahrain | 239 500 | 279 400 | 220 000 | B++ | - |
Igi | UAE | 179 333 | 152 862 | 143 376 | BBB- | - |
Kuwait Re | Kuwait | 118 578 | 92 289 | 38 903 | A- | BBB |
Acr Retakaful | Bahrain | 118 175 | 77 655 | 200 000 | A- | - |
Qre | Qatar | 80 800 | ND | 100 000 | - | A |
Hannover Re Takaful | Bahrain | 79 893 | 56 068 | 52 826 | - | A |
Al Fajer Re | Kuwait | 58 300 | 27 000 | 181 555 | B++ | - |
Arab Re | Lebanon | 53 672 | 55 354 | 60 000 | B+ | - |
Takaful Re | UAE | 36 164 | 48 669 | 125 000 | - | BBB |
Gulf Re | UAE | 35 245 | 24 500 | 400 000 | A- | - |
Arab Union Re | Syria | 29 545 | 27 840 | 50 000 | - | - |
Saudi Re | Saudi Arabia | 28 656 | 13 608 | 266 630 | - | BBB+ |
Ace Mena | UAE | 28 500 | ND | ND | - | AA- |
Oman Re | Oman | 17 000 | 3 250 | 13 700 | - | - |
Iraq Re | Iraq | 15 000 | 13 000 | 2 550 | - | - |
Africa zone
in thousands USD| Country | Turnover 2010 | Turnover 2009 | Capital 2010 | AM Best rating | S & P rating | Other ratings | |
|---|---|---|---|---|---|---|---|
| North Africa | |||||||
Scr | Morocco | 259 218 | 269 362 | 117 900 | B++ | BBB | - |
Ccr | Algeria | 129 262 | 121 538 | 171 470 | B+ | - | - |
Tunis Re | Tunisia | 50 612 | 45 340 | 30 894 | B+ | - | - |
National Re | Sudan | 29 000 | 28 215 | 895 | - | - | - |
| East Africa | |||||||
ZEP Re | Kenya | 59 843 | 55 749 | 30 514 | B | - | - |
Kenya Re | Kenya | 58 600 | 49 090 | 18 000 | B+ | - | - |
Tanzania Re | Tanzania | 28 199 | 27 171 | 7 811 | - | - | BB- (GCR) |
East Africa Re | Kenya | 18 144 | 15 787 | 7 800 | B | - | - |
Uganda Re | Uganda | ND | ND | ND | - | - | - |
| West Africa | |||||||
Africa Re | Nigeria | 627 532 | 536 382 | 199 059 | A- | A- | - |
Continental Re | Nigeria | 66 856 | 42 655 | 33 815 | B+ | - | - |
Cica Re | Togo | 33 751 | 30 532 | 39 600 | - | - | BB+ (GCR) |
Sen Re | Senegal | 23 218 | 22 204 | 12 623 | B- | - | - |
Colina Re | Togo | 17 936 | ND | ND | - | - | - |
Aveni Re | Cote d’Ivoire | 15 260 | 14 600 | 9 900 | - | - | - |
Nigeria Re | Nigeria | ND | 10 093 | ND | - | - | - |
Mainstream Re | Ghana | ND | 4 558 | 2 996 | - | - | - |
Ghana Re | Ghana | 553 | 570 | 30 414 | B | - | - |
Globus Re2 | Burkina Faso | - | - | 4 000 | - | - | - |
| Austral Africa* | |||||||
Munich Re3 | South Africa | 311 600 | 249 500 | 244 2004 | - | A | - |
General Re3 | South Africa | 200 500 | 161 000 | 75 4004 | A++ | AA+ | - |
Hannover Life Re Africa3 | South Africa | 182 100 | 129 500 | 62 1004 | - | A | - |
Swiss Re Life & Health Africa3 | South Africa | 158 300 | 148 300 | 49 3004 | A | - | - |
Hannover Re Africa3 | South Africa | 141 700 | 132 000 | 88 6004 | - | A | - |
Scor | South Africa | 46 940 | - | ND | A | A | - |
Baobab Re (Ex Zim RE) | Zimbabwe | 29 030 | 24 413 | 49 062 | - | - | B+ (GCR) |
Namibia Re | Namibia | ND | 10 473 | 2 967 | - | - | BB (GCR) |
Asia zone
in thousands USD| Country | Turnover 2010 | Turnover 2009 | Capital 2010 | AM Best rating | S & P rating | |
|---|---|---|---|---|---|---|
Korean Re Company* | South Korea | 3 995 112 | 3 664 460 | 51 837 | A | A- |
China Reinsurance Corporation | China | 3 796 000 | 3 803 000 | ND | A | - |
General Insurance Corp. of India (GIC) | India | 2 137 253 | 1 718 633 | 94 385 | A- | - |
Toa Re* | Japan | 2 021 000 | 1 751 000 | 53 740 | A+ | A+ |
Tokio Marine* | Japan | 1 466 000 | 1 419 000 | ND | A++ | AA- |
Asia Capital Re Group | Singapore | 752 000 | 515 000 | ND | A- | A- |
Central Re | Taiwan | 450 937 | 427 422 | 187 480 | A | A- |
Best Re | Malaysia | 370 900 | 304 700 | 150 000 | A- | A- |
Malaysian Re | Malaysia | 353 697 | 274 415 | 162 070 | A- | - |
Taiping Re Company | Hong Kong | 340 437 | 228 880 | 205 568 | A- | A- |
Taiwan Fire & Marine Ins. | Taiwan | ND | 134 055 | 107 763 | - | BBB+ |
National Re Corp. | Philippines | 97 476 | 76 210 | 49 705 | B++ | - |
Asia Capital Re Malaysia | Malaysia | 80 703 | 54 963 | 81 035 | A- | - |
Singapore Re | Singapore | 79 346 | 62 701 | 95 481 | A- | - |
Labuan Re | Malaysia | 59 286 | 48 948 | 150 000 | A- | - |
Asian Re Corp. | Thailand | 57 500 | 53 000 | 30 239 | B++ | - |
Thai Re PLC | Thailand | 47 477 | 37 467 | 39 325 | - | A- |