Oman Insurance Company
 Oman Insurance, a life and non-life company, relies on its headquarters in Dubai to market its products through 16 branches in the United Arab Emirates and two others respectively located in Qatar and Oman. Despite a slowdown of its turnover during the past three years, the company continued to report remarkable technical results.
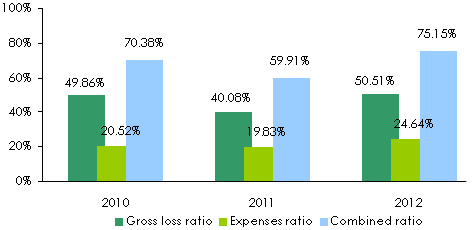
With non-life combined ratios of around 50% to 75% between 2010 and 2012, Oman Insurance is strengthening its financial base. Nearly 50% of its 2012 turnover is underwritten in life insurance.
 |  |
| Abdulaziz Abdulla Al-Ghurair | Patrick Choffel |
| Chairman of the board | CEO |
Oman Insurance Company in 2012
| Share capital | 125 749 271 USD |
| Turnover | 665 203 000 USD |
| Total assets | 1 255 647 329 USD |
| Shareholder’s equity | 432 588 469 USD |
| Net technical result | 51 252 000 USD |
| Net profit | 51 006 000 USD |
| Gross loss ratio* | 50.51% |
| Expenses ratio* | 24.64% |
| Combined ratio | 75.15% |
| Number of branches | 16 in the United Arab Emirates, one branch in Qatar and one in Oman |
Management
| Chairman of the board | Abdulaziz Abdullah Al-Ghurair |
| Vice chairman | Abdul Raouf Al Shaikh Ahmed Al Mubarak |
| CEO | Patrick Choffel |
Main shareholder
| Mashrek Bank | 63.65% |
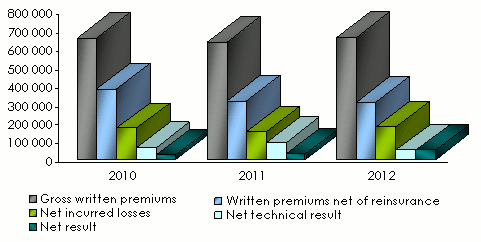
Main technical highlights: 2010-2012
in thousands USD| 2010 | 2011 | 2012 | 2011/2012 evolution | |
|---|---|---|---|---|
Gross written premiums | 659 385 | 637 625 | 665 203 | 4.33% |
Written premiums net of reinsurance | 383 905 | 320 102 | 314 603 | -1.72% |
Gross earned premiums | 659 357 | 663 420 | 677 350 | 2.10% |
Gross incurred losses | 367 586 | 304 958 | 356 358 | 16.85% |
Net incurred losses | 171 516 | 153 232 | 178 271 | 16.34% |
Gross management expenses | 125 791 | 111 784 | 117 067 | 4.72% |
Non life gross management expenses | 96 035 | 81 857 | 82 987 | 1.38% |
Gross loss ratio* | 49,86% | 40.08% | 50.51% | - |
Gross expenses ratio* | 20.52% | 19.83% | 24.64% | - |
Combined ratio | 70.38% | 59.91% | 75.15% | - |
Financial income | 669 | 2 261 | 9 853 | 335.76% |
Net technical result | 64 575 | 91 386 | 51 252 | -43.92% |
Net result | 25 621 | 29 451 | 51 006 | 73.18% |
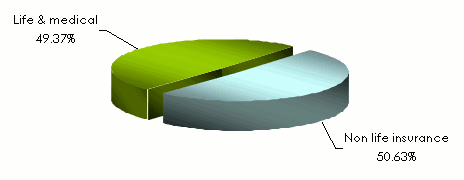
Breakdown of gross written premiums per class of business: 2010-2012
in thousands USD| 2010 | 2011 | 2012 | 2011/2012 evolution | 2012 shares | |
|---|---|---|---|---|---|
Non life insurance | 467 851 | 412 746 | 336 784 | -18.40% | 50.63% |
Life insurance and medical | 191 533 | 224 879 | 328 419 | 46.04% | 49.37% |
Total | 659 385 | 637 625 | 665 203 | 4.32% | 100% |
Breakdown of gross written premiums per class of business in 2012
Breakdown of gross earned premiums per class of business: 2010-2012
in thousands USD| 2010 | 2011 | 2012 | 2011/2012 evolution | 2012 shares | |
|---|---|---|---|---|---|
Non life insurance | 468 430 | 436 790 | 372 697 | -14.67% | 55.02% |
Life insurance and medical | 190 927 | 226 630 | 304 653 | 34.43% | 44.98% |
Total | 659 357 | 663 420 | 677 350 | 2.10% | 100% |
Breakdown of net earned premiums per class of business: 2010-2012
in thousands USD| 2010 | 2011 | 2012 | 2011/2012 evolution | 2012 shares | |
|---|---|---|---|---|---|
Non life insurance | 254 621 | 236 050 | 186 717 | -20.89% | 56.66% |
Life insurance and medical | 82 904 | 95 887 | 142 847 | 48.97% | 43.34% |
Total | 337 525 | 331 937 | 329 564 | -0.71% | 100% |
Net technical results : 2010-2012
in thousands USD| 2010 | 2011 | 2012 | 2011/2012 evolution | 2012 shares | |
|---|---|---|---|---|---|
Non life insurance | 56 464 | 68 464 | 20 348 | -70.27% | 39.70% |
Life insurance and medical | 8 110 | 22 922 | 30 904 | 34.82% | 60.30% |
Total | 64 574 | 91 386 | 51 252 | -43.91% | 100% |
Gross incurred losses: 2010-2012
in thousands USD| 2010 | 2011 | 2012 | 2011/2012 evolution | 2012 shares | |
|---|---|---|---|---|---|
Non life insurance | 233 568 | 175 101 | 188 264 | 7.52% | 52.83% |
Life insurance and medical | 134 018 | 129 857 | 168 094 | 29.44% | 47.17% |
Total | 367 586 | 304 958 | 356 358 | 16.85% | 100% |
Net incurred losses: 2010-2012
in thousands USD| 2010 | 2011 | 2012 | 2011/2012 evolution | 2012 shares | |
|---|---|---|---|---|---|
Non life insurance | 125 639 | 112 772 | 105 942 | -6.05% | 59.43% |
Life insurance and medical | 45 877 | 40 460 | 72 329 | 78.76% | 40.57% |
Total | 171 516 | 153 232 | 178 271 | 16.34% | 100% |
Non life technical ratios : 2010-2012
Exchange rate AED/USD as at 31/12 | 2010 | 2011 | 2012 |
0.27231 | 0.2723 | 0.27226 |

Contact
| Head office | Dubai Airport Free Zone, Al Twar, Building 5W, 7th & 8th floor, Dubai |
| Phone | (+971) 4 233 7777 |
| Fax | (+971) 4 233 7775 |
oicem [at] tameen [dot] ae | |
| Website |
Live coverage
05/07
05/07
05/07
05/07
05/06
Latest news