


- Date of creation: 4 August 2008, Muscat, Oman
- Classes of business: Non-life
- Rating: Fitch Ratings : BB+ / Positive
- Regional structures: Doha, Qatar
Oman Re in 2022
|


| Share capital | 84 800 000 USD |
| Turnover | 95 164 000 USD |
| Assets | 285 000 000 USD |
| Shareholder’s equity | 76 000 000 USD |
| Net result | 4 232 000 USD |
| ROE | 5.57% |
| Net loss ratio | 58.41% |
| Management expenses ratio | 37.69% |
| Net combined ratio | 96.1% |
Management
| Juma Bin Ali Al Juma | Chairman of the Board of Directors |
| Romel Tabaja | Chief Executive Officer (CEO) |
| Muzamil Hussain | Chief Financial Officer (CFO) |
| Bashar Raoof | General Manager − QFC Branch |
Shareholding as at 31/12/2022
| Shareholders | Shares |
|---|---|
| Trust Insurance and Reinsurance Company (Trust Re), Bahrain | 27.2% |
| Qatar General Insurance & Reinsurance Company (QGIRCO), Qatar | 22.3% |
| Ziliano Investments, Cyprus | 9.1% |
| Zawawi Trading Company, Oman | 8.6% |
| Omar Zawawi Establishment (OMZEST), Oman | 8.4% |
| Others | 24.4% |
Oman Re: main technical highlights: 2018-2022
Figures in USD
| Highlights | 2018 | 2019 | 2020 | 2021 | 2022 |
|---|---|---|---|---|---|
| Gross written premiums | 58 107 000 | 53 022 000 | 64 431 000 | 71 796 000 | 95 164 000 |
| Net written premiums | 23 972 000 | 23 433 000 | 36 238 000 | 53 073 000 | 75 113 000 |
| Net earned premiums | 20 032 000 | 22 601 000 | 30 649 000 | 46 389 000 | 65 707 000 |
| Net incurred losses | 11 060 000 | 15 037 000 | 19 047 000 | 29 262 000 | 38 381 000 |
| Management expenses (1) | 8 699 000 | 8 238 000 | 12 972 000 | 19 276 000 | 28 309 000 |
| Net loss ratio (2) | 55.21% | 66.54% | 62.14% | 63.08% | 58.41% |
| Management expenses ratio (3) | 36.29% | 35.15% | 35.8% | 36.32% | 37.69% |
| Combined ratio (4) | 91.5% | 101.69% | 97.94% | 99.4% | 96.1% |
| Net result (after tax) | 1 716 000 | 2 118 000 | 3 772 000 | 3 525 000 | 4 232 000 |
(1) Data estimated based on loss ratio and combined ratio provided by Oman Re.
(2) Net loss ratio = Net incurred losses / Net earned premiums
(3) Management expenses ratio = Management expenses / Net written premiums
(4) Combined ratio = Net loss ratio + Management expenses ratio
Exchange rate as at 31/12/2022 : 1 OMR = 2.58954 USD ; 31/12/2021 : 1 OMR = 2.58961 USD ; 31/12/2020 : 1 OMR = 2.59113 USD ; 31/12/2019 : 1 OMR = 2.59079 USD ; 31/12/2018 : 1 OMR = 2.59062 USD
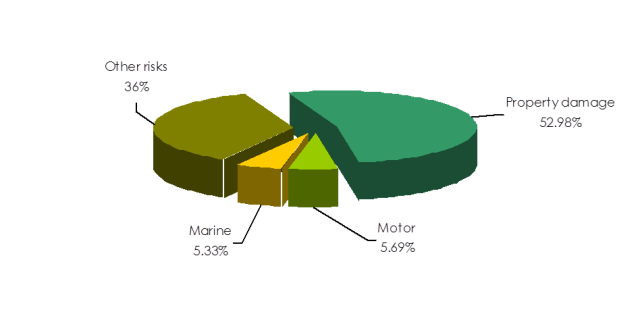
Oman Re: turnover breakdown by class of business : 2018-2022
Figures in USD
| Classes of business | 2018 | 2019 | 2020 | 2021 | 2022 | 2022 shares | 2021-2022 evolution (1) |
|---|---|---|---|---|---|---|---|
| Property damage | NA | 39 163 000 | 48 974 000 | 38 914 000 | 50 415 000 | 52.98% | 29.55% |
| Motor | NA | 1 904 000 | 4 105 000 | 5 694 000 | 5 414 000 | 5.69% | -4.92% |
| Marine | NA | 3 051 000 | 3 212 000 | 4 066 000 | 5 077 000 | 5.33% | 24.86% |
| Other risks | NA | 8 904 000 | 8 140 000 | 23 122 000 | 34 258 000 | 36% | 48.16% |
| Total | 58 107 000 | 53 022 000 | 64 431 000 | 71 796 000 | 95 164 000 | 100% | 32.55% |
Oman Re: net written premiums by type of activity: 2018-2022
Figures in USD
| 2018 | 2019 | 2020 | 2021 | 2022 | 2021-2022 evolution (1) | |
|---|---|---|---|---|---|---|
| Facultative business | 9 653 000 | 13 566 000 | 17 418 000 | 23 373 000 | 39 046 000 | 67.06% |
| Treaties | 14 319 000 | 9 867 000 | 18 820 000 | 29 700 000 | 36 067 000 | 21.44% |
| Total | 23 972 000 | 23 433 000 | 36 238 000 | 53 073 000 | 75 113 000 | 41.53% |
Oman Re: net earned premiums by type of activity: 2018-2022
Figures in USD
| 2018 | 2019 | 2020 | 2021 | 2022 | 2021-2022 evolution (1) | |
|---|---|---|---|---|---|---|
| Facultative business | 7 262 000 | 11 305 000 | 14 698 000 | 19 449 000 | 33 418 000 | 71.82% |
| Treaties | 12 770 000 | 11 296 000 | 15 951 000 | 26 940 000 | 32 289 000 | 19.86% |
| Total | 20 032 000 | 22 601 000 | 30 649 000 | 46 389 000 | 65 707 000 | 41.65% |
Oman Re: net incurred losses by type of activity: 2018-2022
Figures in USD
| 2018 | 2019 | 2020 | 2021 | 2022 | 2021-2022 evolution (1) | |
|---|---|---|---|---|---|---|
| Facultative business | 3 210 000 | 7 482 000 | 8 472 000 | 7 816 000 | 18 792 000 | 140.44% |
| Treaties | 7 850 000 | 7 555 000 | 10 575 000 | 21 446 000 | 19 589 000 | -8.66% |
| Total | 11 060 000 | 15 037 000 | 19 047 000 | 29 262 000 | 38 381 000 | 31.17% |
(1)Growth rate in local currency
Exchange rate as at 31/12/2022 : 1 OMR = 2.58954 USD ; 31/12/2021 : 1 OMR = 2.58961 USD ; 31/12/2020 : 1 OMR = 2.59113 USD ; 31/12/2019 : 1 OMR = 2.59079 USD ; 31/12/2018 : 1 OMR = 2.59062 USD
Oman Re: net loss ratio by type of activity: 2018-2022
Figures in USD
| 2018 | 2019 | 2020 | 2021 | 2022 | |
|---|---|---|---|---|---|
| Facultative business | 44.19% | 66.18% | 57.64% | 40.19% | 56.23% |
| Treaties | 61.47% | 66.89% | 66.29% | 79.61% | 60.67% |
| Total | 55.21% | 66.54% | 62.14% | 63.08% | 58.41% |
(1)Growth rate in local currency
Exchange rate as at 31/12/2022 : 1 OMR = 2.58954 USD ; 31/12/2021 : 1 OMR = 2.58961 USD ; 31/12/2020 : 1 OMR = 2.59113 USD ; 31/12/2019 : 1 OMR = 2.59079 USD ; 31/12/2018 : 1 OMR = 2.59062 USD
Oman Re: Contact
| Head office | Coral Building, 6th Floor- Al Khuwair South, P.O. Box 1968 Postal Code 114 Muscat, Oman |
| Phone | +968 2439 7700 |
| Fax | +968 2439 7777 |
info@omanre.com.om | |
| Website |