Saudi Arabia 2010
Written premiums in 2010
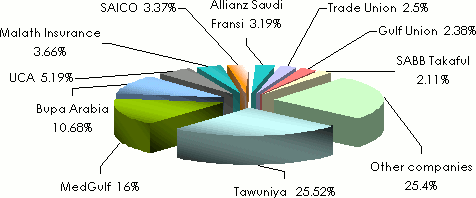
Premiums breakdown per company: 2009-2010
in thousands USD| Premiums 2009 | Premiums 2010 | 2009/10 growth | 2010 market shares | |
|---|---|---|---|---|
Tawuniya | 1 076 023 | 1 115 048 | 3.62% | 25.52% |
MedGulf | 493 164 | 699 434 | 41.82% | 16% |
Bupa Arabia | 359 267 | 466 562 | 29.86% | 10.68% |
UCA | 242 349 | 226 841 | -6.39% | 5.19% |
Malath Insurance | 96 845 | 160 090 | 65.3% | 3.66% |
SAICO | 130 659 | 147 403 | 12.81% | 3.37% |
Allianz Saudi Fransi | 90 083 | 139 594 | 54.96% | 3.19% |
Trade Union | 101 310 | 109 326 | 7.91% | 2.5% |
Gulf Union | 131 905 | 103 903 | -21.22% | 2.38% |
SABB Takaful | 96 930 | 92 174 | -4.9% | 2.11% |
Total of the first ten companies | 2 818 535 | 3 260 375 | 15.67% | 74.6% |
Other companies* | 1 077 248 | 1 110 145 | 3.05% | 25.4% |
Grand total | 3 895 783 | 4 370 520 | 12.18% | 100% |
Market breakdown per company in 2010
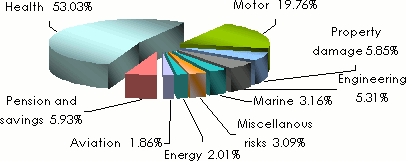
Turnover breakdown per class of business in 2010
in thousands USD| Premiums 2009 | Premiums 2010 | 2009/10 growth | 2010 market shares | |
|---|---|---|---|---|
Motor | 814 722 | 863 788 | 6.02% | 19.76% |
Property damage | 241 292 | 255 685 | 5.96% | 5.85% |
Marine | 139 991 | 138 204 | -1.27% | 3.16% |
Engineering | 216 066 | 231 815 | 7.28% | 5.31% |
Miscellaneous risks1 | 144 978 | 135 164 | -6.76% | 3.09% |
Energy | 80 448 | 87 718 | 9.03% | 2.01% |
Aviation | 46 424 | 81 210 | 74.93% | 1.86% |
Total non life | 1 683 921 | 1 793 584 | 6.51% | 41.04% |
Health | 1 944 439 | 2 317 650 | 19.19% | 53.03% |
Pension and savings | 267 423 | 259 286 | -3.04% | 5.93% |
Total | 3 895 783 | 4 370 520 | 12.18% | 100% |
Breakdown of the market shares per class of business in 2010
Exchange rate SAR/USD as at 31/12 | 2009 | 2010 |
0.26670 | 0.26670 |