Arabie Saoudite 2010
Primes émises 2010
Répartition des primes 2009-2010 par société
en milliers USD| Primes 2009 | Primes 2010 | Croissance 2009-2010 | Parts de marché 2010 | |
|---|---|---|---|---|
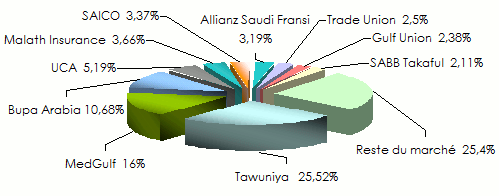
Tawuniya | 1 076 023 | 1 115 048 | 3,62% | 25,52% |
MedGulf | 493 164 | 699 434 | 41,82% | 16% |
Bupa Arabia | 359 267 | 466 562 | 29,86% | 10,68% |
UCA | 242 349 | 226 841 | -6,39% | 5,19% |
Malath Insurance | 96 845 | 160 090 | 65,3% | 3,66% |
SAICO | 130 659 | 147 403 | 12,81% | 3,37% |
Allianz Saudi Fransi | 90 083 | 139 594 | 54,96% | 3,19% |
Trade Union | 101 310 | 109 326 | 7,91% | 2,5% |
Gulf Union | 131 905 | 103 903 | -21,22% | 2,38% |
SABB Takaful | 96 930 | 92 174 | -4,9% | 2,11% |
Total des dix premières sociétés | 2 818 535 | 3 260 375 | 15,67% | 74,6% |
Reste du marché* | 1 077 248 | 1 110 145 | 3,05% | 25,4% |
Total général | 3 895 783 | 4 370 520 | 12,18% | 100% |
Répartition du marché 2010 par société
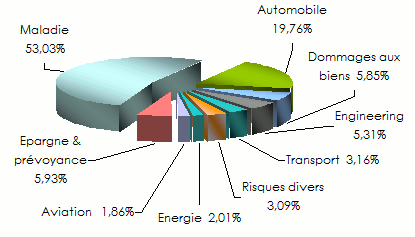
Répartition du chiffre d'affaires 2010 par branche
en milliers USD| Primes 2009 | Primes 2010 | Evolution 2009-2010 | Parts de marché 2010 | |
|---|---|---|---|---|
Automobile | 814 722 | 863 788 | 6,02% | 19,76% |
Dommages aux biens | 241 292 | 255 685 | 5,96% | 5,85% |
Transport | 139 991 | 138 204 | -1,27% | 3,16% |
Engineering | 216 066 | 231 815 | 7,28% | 5,31% |
Risques divers1 | 144 978 | 135 164 | -6,76% | 3,09% |
Energie | 80 448 | 87 718 | 9,03% | 2,01% |
Aviation | 46 424 | 81 210 | 74,93% | 1,86% |
Total2 | 1 683 921 | 1 793 584 | 6,51% | 41,04% |
Maladie | 1 944 439 | 2 317 650 | 19,19% | 53,03% |
Epargne et prévoyance | 267 423 | 259 286 | -3,04% | 5,93% |
Total | 3 895 783 | 4 370 520 | 12,18% | 100% |
Répartition des parts de marché 2010 par compagnie
 Taux de change au 31/12/2009 : 1 SAR = 0,26670 USD; au 31/12/2010 : 1 SAR = 0,26670 USD
- Vous devez vous identifier ou créer un compte pour écrire des commentaires
