Sovereign Wealth Funds (SWFs)
The ultimate goal is both to ensure that future generations get stable resources and to support the national economy in times of crisis.
Ignored for so long by sovereign wealth funds, insurance has started to benefit from this financial windfall.
Historical background
 The first sovereign wealth fund, the «Kuwait Investment Board» was established in 1953 in Kuwait, that is 8 years before independence of the emirate. It was designed to manage the State’s surpluses generated by the oil industry.
The Kuwaiti example was followed three years later by the State of Kiribati, an archipelago in the Pacific Ocean, which would in turn create the «Revenue Equalization Reserve Fund» in 1956. As of 1974, the phenomenon has spread out to many countries in America, Asia and the Middle East, reaching Europe in 1990 with the creation of a major fund, the «Petroleum Fund» of Norway. The first investment fund created in Africa was the «Pula Fund» of Botswana whose origin dates back to 1994.
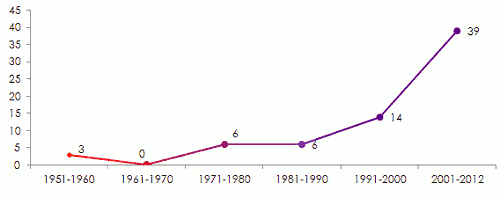
This trend, however, lost momentum with only 24 funds established between 1953 and 1999. It was not until the 2000s that the phenomenon started to revive with the development of 32 additional funds between 2000 and 2008. The 2008 financial crisis strained the global economic environment, slowing down the growth of investment funds.
Features
All sovereign wealth funds are based on the same principle, but not all have the same goals or the same areas of investment, much less the same resources.
The resources most frequently used in the creation of a fund come from oil and gas rents which represent the funding base of 45 funds against 25 funds for other sources of income (mineral and others).
At the end of May 2013, there are 70 sovereign wealth funds scattered around 46 countries. The overall assets under management of these entire funds amount to 5846.6 billion USD. This amount is increasing by 12.43% compared to 2012 when it totaled only 5 200 billion USD of assets under management.
Investment funds sectors are very diverse. In 2012 nearly three-quarters of the transactions were made in the areas of finance, real estate and raw materials.
Some investments in the insurance sector
Investments in the insurance industry are at their beginning 1 , with most operations being carried out by emerging countries.
In 2012- Government of Singapore Investment Corportaion «GIC» was in control of 10.61% of China Pacific Insurance Company.
- Abu Dhabi Investment Authority «ADIA» hold 75% of China Pacific Insurance Company.
- Invest Corporation of Dubai has signed an agreement with Samsung Life Insurance (South Korea) with a view to explore the opportunities of life insurance sector at the international level.
- Kuwait Investment Authority «KIA» invested 1 billion USD in AIA Group.
Fund management is assessed according to specific criteria, including transparency of financing and investment. The evaluation of this transparency is carried out by means of the transparency index «Linaburg - Maduell» developed at the «Sovereign Wealth Fund Institute» by Carl Linaburg and Michael Maduell.
Points are awarded based on criteria to be followed by all sovereign funds in order to be qualified as “transparent”. The evaluation is carried out on the basis of the grid below:
| Point | Index principles |
|---|---|
| +1 | Fund provides history, including reason for creation, origins of wealth, and government ownership structure |
| +1 | Fund provides up-to-date independently audited annual reports |
| +1 | Fund provides ownership percentage of company holdings and geographic location of holdings |
| +1 | Fund provides total portfolio market value, returns, and management compensation |
| +1 | Fund provides guidelines in reference to ethical standards, investment policies, and enforcer of guidelines |
| +1 | Fund provides clear strategies and objectives |
| +1 | Fund clearly identifies subsidiaries and contact information |
| +1 | Fund identifies external managers |
| +1 | Fund manages its own website |
| +1 | Fund provides main office location address and contact information (telephone and fax) |
The choice of investment sectors varies from one fund to another. However, the State fund investment policy is based on a common model:
- The search for profitability
- a moderate degree of active management
- a clear governance structure
- reliable investment practices
- collection of risks’ premiums
Top 20 funds in terms of assets under management worldwide 1
in billions USD| Country | Sovereign wealth fund’s name | Inception | Origin | L-M index | Assets |
|---|---|---|---|---|---|
Norway | Government Pension Fund - Global | 1990 | Oil | 10 | 737.2 |
Saudi Arabia | SAMA Foreign Holdings | 1997 | Oil | 4 | 675.9 |
Abu Dhabi (U.A.E) | Abu Dhabi Investment Authority | 1976 | Oil | 5 | 627 |
China | China Investment Corporation | 2007 | Non-commodity | 7 | 575.2 |
China | SAFE Investment Company | 1997 | Non-commodity | 4 | 567.9 |
Kuwait | Kuwait Investment Authority | 1953 | Oil | 6 | 386 |
Hong Kong (China) | Hong Kong Monetary Authority Investment Portofolio | 1993 | Non-commodity | 8 | 326.7 |
Singapore | Government of Singapore Investment Corporation | 1981 | Non-commodity | 6 | 285 |
Russia | National Welfare Fund | 2008 | Oil | 5 | 175.5 |
Singapore | Temasek Holdings | 1974 | Non-commodity | 10 | 173.3 |
China | National Social Security Fund | 2000 | Non-commodity | 5 | 160.6 |
Qatar | Qatar Investment Authority | 2005 | Oil | 5 | 115 |
Australia | Australian Future Fund | 2006 | Non-commodity | 10 | 88.7 |
Algeria | Revenue Regulation Fund | 2000 | Oil & gas | - | 77.2 |
Dubai (U.A.E) | Investment Corporation of Dubai | 2006 | Oil | 4 | 70 |
Kazakhstan | Kazakhstan National Fund | 2000 | Oil | 8 | 68.9 |
Abu Dhabi (U.A.E) | International Petroleum Investment Company | 1984 | Oil | 9 | 65.3 |
Libya | Libyan Investment Authority | 2006 | Oil | - | 65 |
South Korea | Korea Investment Corporation | 2005 | Non-commodity | 9 | 56.6 |
Abu Dhabi (U.A.E) | Mubadala Development Company | 2002 | Oil | 10 | 53.1 |
Top 20 | - | - | - | - | 5350.1 |
Rest of the world | - | - | - | - | 496.5 |
World total | - | - | - | - | 5846.6 |
Number of funds created per decade
The different types of funds
A study by the International Monetary Fund (IMF) conducted in 2008 has allowed the classification of SWFs according to the roles and objectives assigned to them:
Stabilization funds: they are designed to ensure the public finances and the economy of a State to protect it against the volatility of commodity prices (oil, gas, etc).
Development funds: they are designed to finance socio-economic projects such as the development of emerging areas. They also aim to promote domestic industrial projects in order to boost GDP growth.
The pension reserve funds: also called reserve fund contingency plan, it is designed to help meet the financial needs related to any domestic pension fund deficit.
Saving funds for future generations: they aim to transform non-renewable assets into renewable assets to diversify the investment portfolio.
The investment reserve funds: they are entrusted with the management of the national foreign exchange reserves.
The role of funds
At the national level
At the national level, the SWFs are focused on foresight, allowing to save incomes for future generations who will no longer possess natural resources. By investing the surplus of current incomes in new activities, the States diversify their future GDP sources.
The second objective, the funds allow the States to cope with negative market fluctuations, playing, therefore, the role of economic stabilizer.
At the international level
By buying government bonds, sovereign funds carry out investments in the economies of borrowing countries. This long-term investment diversification policy provides funds with better security to hazards related to portfolio-management.
The SWFs are actively involved in financing infrastructure internationally.
SWFs and the 2008 economic crisis
The SWFs have played a major role in the management of the subprime crisis. Their liquidity reserves have been a blessing for financial institutions that seriously needed them. They injected more than 66 billion USD in six months of crisis and participated in the recapitalization of certain financial institutions in distress.
For instance, the following examples can be mentioned:
- The CIC fund (China) has acquired 9.9% of Morgan Stanley for 5 billion USD.
- The GIC fund (Singapore) disbursed 7 billion USD to acquire 4.5% of Citigroup and 10 billion USD for 9% of UBS capital.
- The Tamaesk funds (Singapore) has invested 4.4 billion USD to control 9.9% of Merrill Lynch.
- The ADIA funds (Abu Dhabi) has bought 4.5% of Citigroup for 7.5 billion USD.
It is worth noting that all of these investments were solely intended to recapitalize financial institutions that lacked liquidity and had no intention to get involved in the governance of institutions.
SWFs by geographic region
In Africa
In 2013, the African continent counts nine sovereign wealth funds, including five development funds (Botswana, Gabon, Equatorial Guinea, Ghana, Libya) and four stabilization funds (Algeria, Angola, Mauritania, Nigeria). These nine funds manage about 3 % of the world total assets of State funds, or about 156 billion USD.
With the «Revenue Stabilization Fund», Algeria holds 49.5% of African fund assets, closely followed by Libya with the «Libyan Investment Authority» controlling 41.68% of the assets of these same funds. The rest of the African assets is allocated among the funds of Botswana (4.42%), Angola (3.21%), Nigeria (0.64%), Gabon (0.26%), Mauritania (0.2%), Equatorial Guinea (0.05%) and Ghana (0.04%).
In Africa, State funds are mainly financed by oil revenues, with the exception of Botswana’s «Pula Fund» which controls the exploitation of diamonds and other minerals and Mauritania whose income is derived from iron mining.
Apart from Libya and to a lesser extent Angola which are diversifying investment sectors, the other African funds prefer investments in State bonds and other financial investments.
Major investment areas for African funds:
- tourism and hotel business (Angola, Libya)
- acquisition of financial holdings, investments in fixed income securities, government bonds, etc. (Algeria, Angola, Botswana, Gabon, Libya, Nigeria)
- trade and industry (Libya)
- real estate and infrastructure (Angola, Libya)
- agriculture (Libya)
- telecommunications (Libya)
- oil and minerals (Libya)
African sovereign funds1
in billions USD| Country | Sovereign wealth fund’s name | Inception | Origin | Assets |
|---|---|---|---|---|
Algeria | Revenue Regulation Fund | 2000 | Oil & gas | 77.2 |
Libya | Libyan Investment Authority | 2006 | Oil | 65 |
Botswana | Pula Fund | 1994 | Diamond & minerals | 6.9 |
Angola | Fundo Soberano de Angola | 2012 | Oil | 5 |
Nigeria | Nigerian Sovereign Investment Authority | 2011 | Oil | 1 |
Gabon | Gabon Sovereign Wealth Fund | 1998 | Oil | 0.4 |
Mauritania | National Fund for Hydrocarbon Reserves | 2006 | Oil & gas | 0.3 |
Equatorial Guinea | Fund for Future Generations | 2002 | Oil | 0.08 |
Ghana | Ghana Petroleum Funds | 2011 | Oil | 0.07 |
Total | - | - | - | 155.95 |
In the Middle East
Being the historic cradle of the first sovereign wealth fund (Kuwait 1953), the Middle East counts 14 State funds established, with the exception of Bahrain, from oil revenue surplus .
Assets held by Middle Eastern sovereign wealth funds amounted to 2014 billion USD, that is 34.45% of global assets managed by all funds.
In 2013, «SAMA Foreign Holdings» and «Abu Dhabi Investment Authority» funds are globally standing in the second and third positions with respectively 675.9 billion USD and 627 billion USD of assets under management.
In 2012, funds from the Gulf and the Middle East have carried out 40% of their operations in Europe, for a total investment of 26.3 billion USD. Nonetheless, the Old Continent is a place where these funds fear to tread because of the crises it went through, especially that of the Euro. Some experts believe that the amounts allocated to Europe were divided by five in favor of investments in the Gulf region which have increased by 70% in 2012 compared to 2011.
The new geographic distribution of the «Abu Dhabi Investment Authority Fund» (ADIA) illustrates well the path pursued by Middle Eastern countries. ADIA has reduced its potential allocation towards Europe and the developed countries. It is mainly the emerging countries which have benefited from this orientation as their investment increased from 8.5% to 13% between 2011 and 2012.
Sovereign funds in the Middle East 1
in billions USD| Country | Sovereign wealth fund’s name | Inception | Origin | L-M Index | Assets |
|---|---|---|---|---|---|
Saudi Arabia | SAMA Foreign Holdings | 1997 | Oil | 4 | 675.9 |
Abu Dhab (U.A.E) | Abu Dhabi Investment Authority | 1976 | Oil | 5 | 627 |
Kuwait | Kuwait Investment Authority | 1953 | Oil | 6 | 386 |
Qatar | Qatar Investment Authority | 2005 | Oil | 5 | 115 |
Dubai (U.A.E) | Investment Corporation of Dubai | 2006 | Oil | 4 | 70 |
Abu Dhabi (U.A.E) | International Petroleum Investment Company | 1984 | Oil | 9 | 65.3 |
Abu Dhabi (U.A.E) | Mubadala Development Company | 2002 | Oil | 10 | 53.1 |
Oman | State General Reserve Fund | 1980 | Oil & gas | 4 | 8.2 |
Bahrain | Mumtalakat Holding Company | 2006 | Non-commodity | 9 | 7.1 |
Saudi Arabia | Public Investment Fund | 2008 | Oil | 4 | 5.3 |
Ras Al Khaimah (U.A.E) | RAK Investment Authority | 2005 | Oil | 3 | 1.2 |
U.A.E | Emirates Investment Authority | 2007 | Oil | 3 | NA |
Oman | Oman Investment Fund | 2006 | Oil | NA | NA |
Abu Dhabi (U.A.E) | Abu Dhabi Investment Council | 2007 | Oil | NA | NA |
Total | - | - | - | - | 2014.1 |
Worldwide
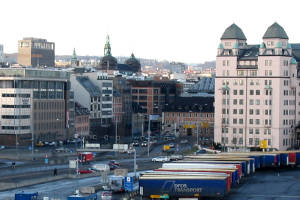 Norway hosts the most important sovereign fund © Tomasz Sieni, CC BY-SA 3.0 (modified picture) Norway hosts the most important sovereign fund © Tomasz Sieni, CC BY-SA 3.0 (modified picture) |
In terms of stock, Norway has the largest sovereign wealth fund. At the end of May 2013, the «Government Pension Fund–Global» has assets under management amounting to 737.2 billion USD. Its Linaburg-Maduell transparency index is 10, the highest possible rating.
According to the geographical breakdown, the Asian funds, with total assets under management of 2190.5 billion USD in 2013, are leading the world ranking, followed by the Middle East with a total of 2014.1 billion USD. Africa manages 155.95 billion USD of funds and the rest of the world 1486.1 billion USD.
| Number of funds per financing source | Breakdown of assets under management per geographic zone |
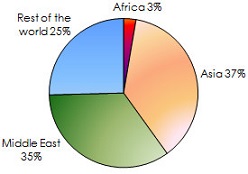 | 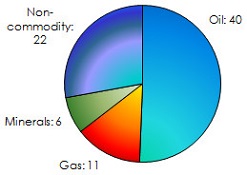 |
Main investors in 2012:
- Qatar Investment Authority:16.8 billion USD
- China Investment Corporation:10 billion USD
- TEMAESK and Government Investment Corporation: 12.3 billion USD
- Khazanah: 4.4 billion USD
Top 20 sovereign funds worldwide (excluding Africa & Middle East)1
in billions USD| Country | Sovereign wealth fund’s name | Inception | Origin | L-M Index | Assets |
|---|---|---|---|---|---|
Norway | Government Pension Fund - Global | 1990 | Oil | 10 | 737.2 |
China | China Investment Corporation | 2007 | Non-commodity | 7 | 575.2 |
China | SAFE Investment Company | 1997 | Non-commodity | 4 | 567.9 |
Hong Kong (China) | Hong Kong Monetary Authority Investment Portofolio | 1993 | Non-commodity | 8 | 326.7 |
Singapore | Government of Singapore Investment Corporation | 1981 | Non-commodity | 6 | 285 |
Russia | National Welfare Fund | 2008 | Oil | 5 | 175.5 |
Singapore | Temasek Holdings | 1974 | Non-commodity | 10 | 173.3 |
China | National Social Security Fund | 2000 | Non-commodity | 5 | 160.6 |
Australia | Australian Future Fund | 2006 | Non-commodity | 10 | 88.7 |
Kazakhstan | Kazakhstan National Fund | 2000 | Oil | 8 | 68.9 |
South Korea | Korea Investment Corporation | 2005 | Non-commodity | 9 | 56.6 |
Iran | National Development Fund of Iran | 2011 | Oil & gas | 5 | 52 |
Alaska (U.S.A) | Alaska Permanent Fund | 1976 | Oil | 10 | 46.8 |
Brunei | Brunei Investment Fund | 1983 | Oil | 1 | 40 |
Malaysia | Khazanah Nasional | 1993 | Non-commodity | 5 | 39.1 |
Azerbaidjan | State Oil Fund | 1999 | Oil | 10 | 34.1 |
France | Strategic Investment Fund | 2008 | Non-commodity | 9 | 25.5 |
Texas (U.S.A) | Texas Permanent School Fund | - | Oil & others | 9 | 25.5 |
Kazakhstan | National Investment Corporation | 2012 | Oil | NA | 20 |
Ireland | National Pensions Reserve Fund | 2001 | Non-commodity | 10 | 19.4 |
Rest of the world | - | - | - | - | 159.8 |
Total | - | - | - | - | 3677.8 |
Weaknesses
Despite these weaknesses, SWFs have acquired the status of indispensable institutional investor as their contribution to the global economy is universally commended.Despite their role in stabilizing the global economy, the SWFs are often criticized both locally and internationally.
Criticism targets the use of funds and the management mode. Some of this criticism includes:
- The lack of transparency associated with their operation.
- Their direct affiliation to the State.
- The selection and location of investment.
- the lack of control.
- the lack of communication.
Despite these weaknesses, SWFs have acquired the status of indispensable institutional investor as their contribution to the global economy is universally commended.
Examples of investments
Some investments made by the «Libyan Investment Authority»
- Acquisition of American Treasury bonds and highly rated European equities
- 355 million USD in foreign currency at HSBC and Goldman Sachs
- 10 million USD invested in BNP Paribas
- 7.5% in Juventus shares (Italian football club)
- Investment in telecom operators in Zambia, Uganda, Niger and Côte d'Ivoire
- Holding acquisition in hotels
- Equity investments in oil companies
Some investments carried out by the «Abu Dhabi Investment Authority» fund
- 7.5 billion USD to acquire 4.9% of Citigroup
- Acquisition of 2 % of Mediaset SPA
- Acquisition of 8% of EFG- Hermes Holding
- Acquisition of 9% of Apollo Management
Some investments carried out by the «China Investment Corporation» fund
- 5 billion USD to control 9.9% of Morgan Stanley
- Acquisition of 9.9% of Blackstone
The «Government Pension Fund-Global» (Norway)
With assets of 737.2 billion USD in portfolio at the end of May 2013 and a score of 10 on the Linaburg – Maduell transparency index, the «Government Pension Fund -Global» (GPFG) is the sovereign wealth fund that manages most assets in the world.
Established in 1990 under the name of the Petroleum Fund of Norway, it changed its name in January 2006 and became the «Government Pension Fund - Global». It is managed by Norges Bank Investment Management, which provides the Norwegian Ministry of Finance with quarterly and annual reports on GPFG activities which are submitted to Parliament by the Ministry. The fund has no future clearly defined commitments, nor is it specifically allocated for pensions. Its main objective is to maximize the share capital of the fund maintaining a moderate level of risk.
The GPFG has a total of about 1.2 % of the companies listed on the global stock exchange. He has with over a 2 % share in 891 companies and more than 5% in 34 of them. Its highest stakes are 9.5% in the Irish company Smurfit Kappa Group.
Its market value has increased from 16.5 billion USD in 1996 to 686 billion USD in 2012. These assets include 61.2% of equity securities, 38.1% of fixed income securities and 0.7% of investments in real estate. Outside Norway, it operates in 65 countries around the world.